Gold price drop hits 1-year low of $3,852 as real yields rise
Key summary
The gold price drop on Nov. 12, 2026 took spot gold to $3,852 an ounce, its lowest in more than a year and over 30% below January's record. Fed hike bets lifted the 10-year real yield to 2.86% and the dollar. Gold rebounded above $3,900 on Nov. 13; PPI and half-point hike odds come next.
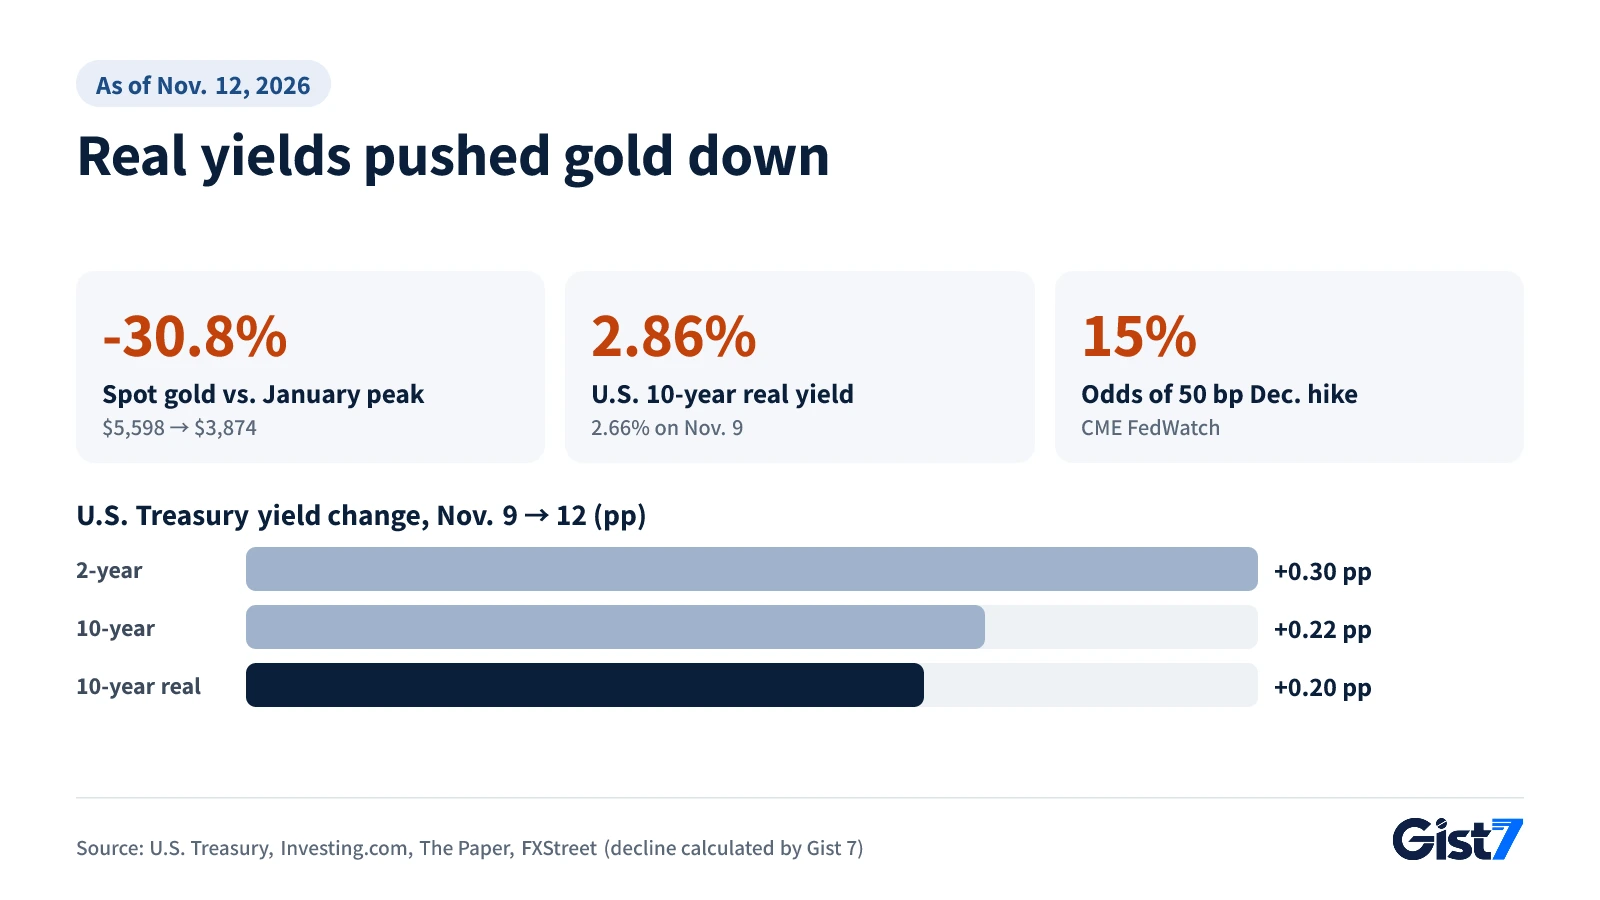
- Spot gold hit an intraday low of $3,852 on Nov. 12, more than 30% below its Jan. 29 record of $5,598 (FXStreet, The Paper)
- 10-year real yield 2.66% → 2.86%, 10-year Treasury 4.88% → 5.10% (Nov. 9 → 12, U.S. Treasury)
- CME FedWatch December odds: about 85% for 25 bp, about 15% for 50 bp (Nov. 12)
- Central banks bought 321 tonnes in Q3, yet North American gold ETFs lost $512 million in October (WGC)
- The won firmed about 0.8% (1,342.1 → 1,330.7 per dollar), slightly deepening gold's fall in won terms
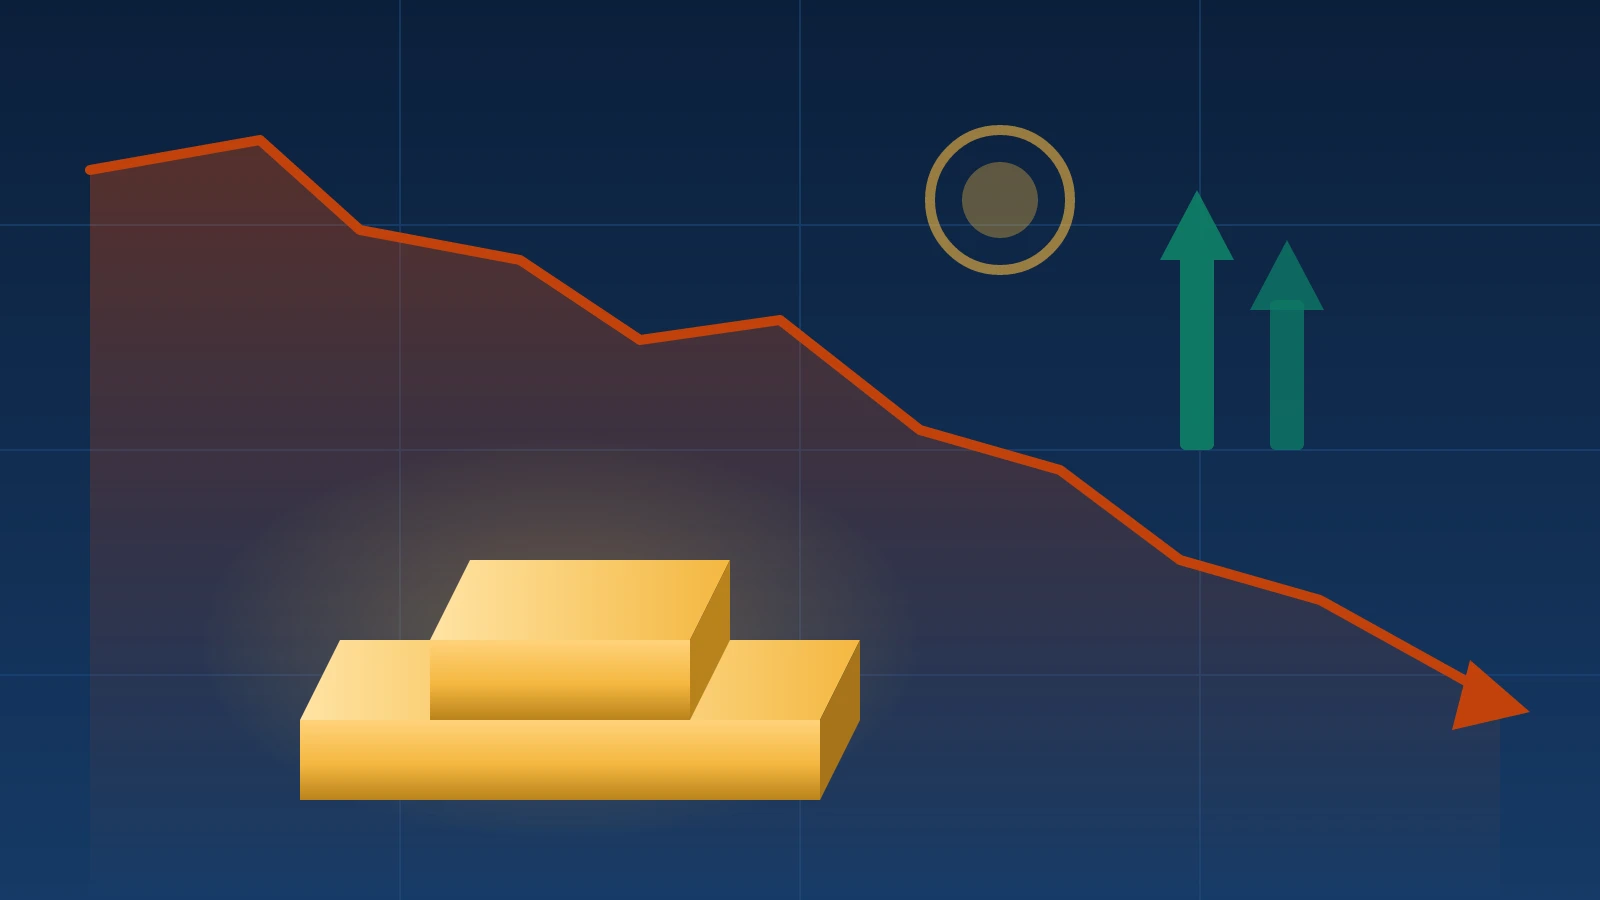
The gold price slid as low as $3,852 an ounce in spot trading on Nov. 12, 2026, its weakest level in more than a year, according to FXStreet. At 4:38 p.m. ET it was trading at $3,874.04, down 2.9% on the day (Investing.com). That leaves the metal more than 30% below its intraday record of $5,598 set on Jan. 29. The gold price drop has one main driver: bets that the Federal Reserve will raise rates in December. Those bets pushed up both U.S. real yields and the dollar, and gold is vulnerable to each.
Why the gold price is falling: real yields and the dollar rose together
The immediate cause is that the 10-year real yield climbed from 2.66% on Nov. 9 to 2.86% on Nov. 12 (U.S. Treasury), while the dollar index rose to 103.48, near a 19-month high (FXStreet). Put simply, holding gold got more expensive. Gold pays no interest, so when the inflation-adjusted return on government bonds goes up, so does the opportunity cost of owning bullion. The real yield is the nominal yield minus expected inflation, and in the U.S. it is tracked through Treasury Inflation-Protected Securities (TIPS).
Treasury data show how quickly that cost rose this week.
| U.S. Treasuries (Treasury par yields) | Nov. 9 | Nov. 12 | Change |
|---|---|---|---|
| 2-year | 4.56% | 4.86% | +0.30 pp |
| 10-year | 4.88% | 5.10% | +0.22 pp |
| 10-year real yield (TIPS) | 2.66% | 2.86% | +0.20 pp |
The 10-year yield peaked at 5.31% on Oct. 5, slipped into the high 4% range by late October and moved back above 5% this week. The key detail: 0.20 point of the 0.22-point rise came from the real yield. Breakeven inflation, calculated simply as the gap between the two yields, barely moved, from 2.22% to 2.24% (Gist 7 calculation). Markets were not betting on hotter inflation so much as on the Fed raising rates to crush it. In Gist 7's view, that is a particularly bad mix for gold. We covered how the 10-year approached 5% in our piece on October CPI and the 10-year yield.
The dollar moved the same way. According to FXStreet, the dollar index rose 0.34% to 103.48 on Nov. 12, near a 19-month high. Because gold is priced in dollars, a stronger greenback makes it costlier for buyers using other currencies. Investing.com noted that spot gold had lost 5.2% over five sessions while the dollar index gained 1.6%.
Oil was a secondary factor. After President Donald Trump posted that the U.S. does not "need a deal" with Iran, Brent crude rose 3.3% to $95.80 a barrel (Investing.com). Inflation scares have often lifted gold, but this time higher oil fed expectations of a more aggressive Fed, which weighed on the metal instead.
How much did gold fall for Korean buyers, and how much did the won add?
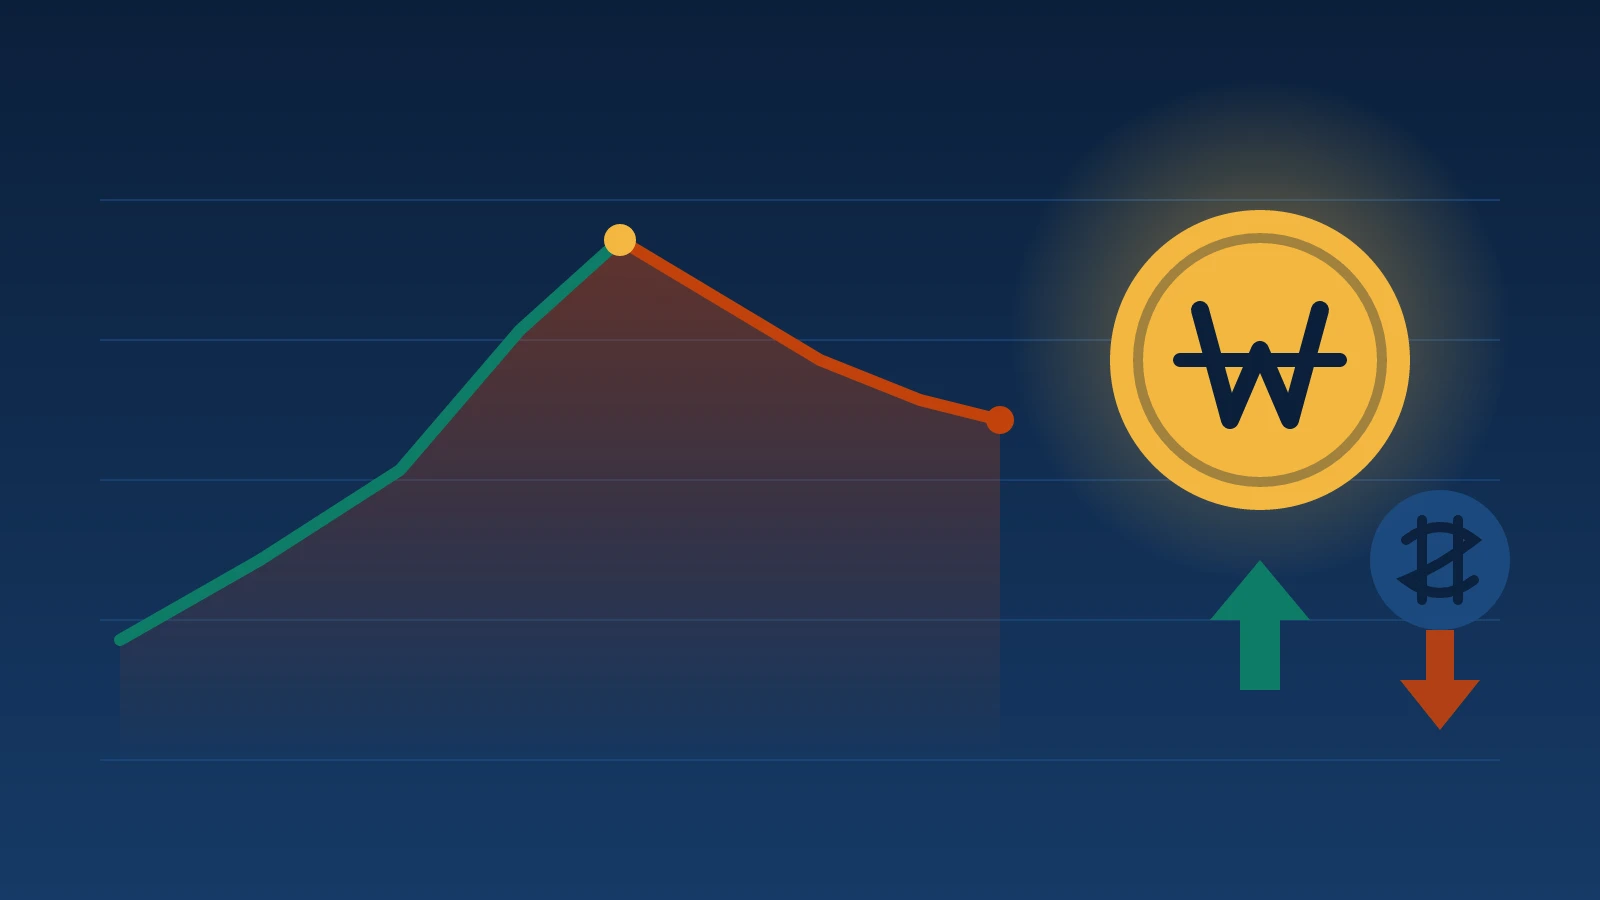
Converted into Korean won at international prices, gold fell about 6.3% from Nov. 5 to Nov. 12, roughly 0.8 point more than the 5.5% drop in dollar terms (Gist 7 calculation). The gap came from a stronger won, since the domestic price tracks the dollar gold price multiplied by the won-dollar exchange rate.
The math: spot gold went from $4,100.27 at 2:05 p.m. ET on Nov. 5 (The Nation Thailand) to $3,874.04 on Nov. 12. Over the same period, the 3:30 p.m. Seoul reference rate fell from 1,342.1 won per dollar (SBS Biz) to 1,330.7 won (Yonhap), a roughly 0.8% gain for the won. Even with the dollar strong worldwide, exporters' dollar sales and foreign buying of Korean stocks lifted the won on Nov. 12 (our piece on the won and the KOSPI). At Nov. 12 international prices, one gram works out to about 165,700 won.
Actual prices on the Korea Exchange (KRX) gold market fell less than that calculation. According to Financial Services Commission commodity price data (compiled by sise.com), the KRX spot gold close (99.99%, 1 kg contract) slipped only 2.0%, from 178,460 won per gram on Nov. 5 to 174,890 won on Nov. 11. The Nov. 12 international conversion sits about 5% below the Nov. 11 KRX close. Even after accounting for gold's 2.9% one-day drop, the domestic price is trading above the international equivalent. The KRX close for Nov. 12 could not be confirmed as of the morning of Nov. 13.
Domestic gold had already taken a big hit. According to the Maeil Shinmun, the KRX spot price per gram on Nov. 5 was 20.52% below its May 13 level of 224,530 won. Twelve of the 13 gold ETFs listed in Korea showed negative six-month returns, and 12 of them saw combined net outflows of 441.2 billion won over six months. Spot-gold ETFs tracking the KRX price, however, have drawn fresh money over the past three months, so Korean investors remain split.
A 15% chance of a half-point hike: what decides the gold price outlook
A quarter-point hike is largely priced in, so the gold price outlook depends less on whether the Fed hikes than on how much and what comes next. According to CME FedWatch, markets priced about an 85% chance of a 25-basis-point hike and about 15% for 50 basis points at the Dec. 8-9 Federal Open Market Committee (FOMC) meeting (Investing.com, Nov. 12). A week earlier, FXStreet noted, the odds of a half-point move were zero.
The spark for half-point bets was Fed Governor Christopher Waller's Nov. 10 speech in London. Waller said he would back a 25-basis-point hike in December even if October inflation improved, and that if core CPI rose around 0.3% or more on the month, "a 50 basis point hike in the policy rate should be considered." Core CPI for October, released the same day by the Bureau of Labor Statistics (BLS), rose 0.3%.
From here, gold's direction depends on conditions:
- If half-point expectations grow, real yields and the dollar could rise again, which tends to weigh further on gold.
- If inflation data cool and markets settle on 25 basis points, gold, already down more than 30%, has room to recover some ground. On Nov. 13 it bounced back above $3,900 after three straight losing sessions, trading around $3,919 (Trading Economics, as of Nov. 13).
- FXStreet flagged $3,852 and $3,800 as support and $4,000 as resistance.
Central banks keep buying while U.S. ETF investors sell
Central bank buying helps put a floor under gold, but day-to-day prices are set by investment money that reacts to rates and the dollar. According to the World Gold Council (WGC), central bank gold demand reached 321 tonnes in the third quarter of 2026, up 42% from a year earlier, and purchases for the first nine months totaled 675 tonnes. Among reported buyers, the People's Bank of China added 63 tonnes and the National Bank of Poland 40 tonnes.
Exchange-traded fund flows split by region. WGC data show global gold ETFs took in $2.7 billion in October, lifting holdings to a month-end record of 4,275 tonnes. But while Europe (+$1.8 billion) and Asia (+$1.3 billion) bought, North American funds lost $512 million, the only region with outflows. That suggests U.S. investors, who react first to rate shifts, are the ones trimming gold. The same rate pressure reached bitcoin ETFs (our piece on bitcoin ETF outflows). China's The Paper also cited profit-taking after the early-year peak and institutional gold sales to ease liquidity strains as U.S. tech stocks fell.
Market impact map
| Asset / indicator | Direction | Strength | Link (why) |
|---|---|---|---|
| Gold (spot) | ↓ | Strong | Higher real yields raise the opportunity cost of non-yielding gold. $3,874.04 on Nov. 12 (-2.9%, 4:38 p.m. ET, Investing.com) |
| 2-year Treasury | ↑ | Strong | Bigger December hike expected. 4.56% → 4.86% (Nov. 9 → 12, U.S. Treasury) |
| 10-year Treasury | ↑ | Strong | Back above 5%, led by real yields. 4.88% → 5.10% (Nov. 9 → 12, U.S. Treasury) |
| 10-year real yield | ↑ | Strong | The classic inverse driver of gold. 2.66% → 2.86% (Nov. 9 → 12, U.S. Treasury) |
| Dollar index | ↑ | Medium | U.S. rate advantage boosts dollar demand. 103.48, near a 19-month high (Nov. 12, FXStreet) |
| Won-dollar | ↓ (stronger won) | Weak | Local dollar supply; slightly deepens gold's fall in won terms (1,330.7 won, Nov. 12 3:30 p.m. Seoul reference rate, Yonhap) |
| Oil (WTI) | ↑ | Medium | Supply worries after Trump's Iran remark; inflation fears feed hike bets ($88.79, +2.7%, Nov. 12, FXStreet) |
| Silver | ↓ | Medium | Sold alongside gold. Down about 3% to around $50 an ounce on Nov. 12 (Trading Economics) |
| KRX spot gold / Korean gold ETFs | ↓ | Medium | Lower dollar gold plus a stronger won. KRX spot gold closed at 174,890 won/g on Nov. 11 (-1.35% on the day, -2.0% from Nov. 5, FSC commodity data); Nov. 12 close unconfirmed |
Little direct impact: bitcoin, S&P 500, Nasdaq, KOSPI
- Jewelry and gold bars: bank and dealer prices follow international gold and the exchange rate. With a spread between buying and selling prices, short-term swings alone say little about gains or losses.
- Gold accounts and gold ETFs: valuations move with both the dollar gold price and the currency rate.
- Currency exchange: for travelers and shoppers paying in dollars from Korea, a won near 1,330 per dollar makes buying dollars slightly cheaper.
Market reactions can vary with other factors, and this table is not a basis for investment decisions.
What to watch next
| Date (ET) | Indicator / event | Previous | Why it matters here | If it comes in… |
|---|---|---|---|---|
| Fri., Nov. 13, 8:30 a.m. | U.S. October Producer Price Index (PPI) | Final demand PPI, Sept.: +1.3% m/m, +6.3% y/y (BLS) | Whether half-point hike bets grow | Hotter than expected: real yields and dollar ↑, gold ↓ tendency |
| Wed., Nov. 25, 8:30 a.m. | U.S. October PCE price index | Sept.: +3.6% y/y (BEA) | The Fed's preferred inflation gauge | Cooler: smaller hike expected, room for gold to rebound |
| Thu., Nov. 26 (Seoul) | Bank of Korea rate decision | Base rate 3.00% (Bank of Korea) | Feeds into won-dollar and won-priced gold | A hike tends to strengthen the won, pressuring gold in won terms |
| Wed., Dec. 9, 2:00 p.m. | FOMC decision and projections (Dec. 8-9 meeting) | 3.75%-4.00% (Fed, held Oct. 28) | The answer to this article's central question | 50 bp: headwind for gold; 25 bp with a gentle path: less pressure |
Frequently asked questions
Why has the gold price fallen so much?
Expectations of a December Fed rate hike pushed up both U.S. real yields and the dollar. The 10-year real yield rose from 2.66% on Nov. 9 to 2.86% on Nov. 12, according to the U.S. Treasury, raising the cost of holding non-yielding gold. Profit-taking after January's record added to the decline.
Will gold fall further if the Fed raises rates?
A 25-basis-point hike is already priced at about 85%, so the size of the move matters more than the hike itself. Rising odds of a half-point hike would tend to lift real yields and the dollar further, while cooler inflation and a gentler path could ease the pressure. The direction cannot be stated with certainty.
Isn't gold supposed to rise with inflation? Why the opposite now?
Inflation worries are translating into expectations of Fed hikes, which push real yields up. This week almost all of the rise in the 10-year yield came from real yields, while breakeven inflation barely moved. When markets believe the central bank will tame inflation, gold's role as an inflation hedge weakens.
Do gold prices in Korea move the same as global prices?
Korean gold prices track the dollar price multiplied by the won-dollar rate, so currency moves matter too. From Nov. 5 to Nov. 12, dollar gold fell about 5.5% and the won firmed about 0.8%, so gold in won terms fell about 6.3% (Gist 7 calculation). KRX gold market prices can differ because of local supply and demand.
Why is gold falling while central banks keep buying?
Central bank purchases support long-term demand, but short-term prices are driven by investment money that reacts to rates and the dollar. The World Gold Council says central bank demand rose to 321 tonnes in Q3, yet North American gold ETFs saw $512 million in outflows in October.
References
- Gold falls about 3% amid extended rise in the dollar on surging Fed rate hike bets — Investing.com (2026-11-12)
- Gold plunges to one-year low near $3,850 as Fed hawks take charge — FXStreet (2026-11-12)
- 金价,跌回一年前 — 澎湃新闻 (2026-11-13)
- Daily Treasury Par Real Yield Curve Rates (2026년 11월) — U.S. Department of the Treasury
- Daily Treasury Par Yield Curve Rates (2026년 11월) — U.S. Department of the Treasury
- Daily Treasury Par Yield Curve Rates (2026년 10월) — U.S. Department of the Treasury
- The Economic Outlook and Some Thoughts on Labor Market Dynamism (Waller, 2026-11-10) — Federal Reserve
- Consumer Price Index – October 2026 — U.S. Bureau of Labor Statistics
- Gold Demand Trends Q3 2026: Central banks — World Gold Council (2026-11-03)
- Gold ETF Flows: October 2026 — World Gold Council
- Gold hits over two-week high of US$4,146.63/oz on Nov 5 — The Nation Thailand (2026-11-06)
- 환율, 수출업체 달러매도 등에 보름 만에 1,320원대로 하락 — 연합뉴스(뉴스통 게재, 2026-11-12)
- '美 민주당 압승'에도 환율, 0.6원 오른 1342.1원 — SBS Biz (2026-11-05)
- KRX 금현물 1kg 시세 (금융위원회 일반상품시세 기반) — 시세.com
- 안전자산 공식 깨진 금시장…금값·ETF 동반 추락, 반등 변수는 — 매일신문 (2026-11-06)
- Gold — Trading Economics (2026-11-13)
- Silver — Trading Economics (2026-11-12~13)
- PPI release schedule — U.S. Bureau of Labor Statistics
- Release Schedule — U.S. Bureau of Economic Analysis
- Meeting calendars and information — Federal Reserve
- 통화정책방향 결정회의 일정 — 한국은행