Bitcoin falls 5 weeks straight: will a Fed hike push it lower?
Key summary
Bitcoin falls for a fifth straight week on weekly closes, 14.2% below its Oct. 5 close at about $73,620 on November 11, 2026, worse than the Nasdaq or gold. U.S. spot ETFs lost $1.28 billion in a week, and with a 25 bp December hike 87% priced in, a 50 bp move and ETF flows are the swing factors.
- Bitcoin has fallen five straight weeks on weekly closes (this week is lower so far), down 14.2% since the Oct. 5 close vs. Nasdaq -7.3% and gold -3.8%
- U.S. spot bitcoin ETFs lost $1.28 billion in the first week of November, flipping 2026 flows to a net outflow of about $914.1 million (The Block)
- According to Newspim, markets priced an 87% chance of a 25 bp December hike and 12.9% for 50 bp (Nov. 11); Fed Governor Waller floated 50 bp if core CPI hit 0.3% or more
- Since Nov. 5 the Nasdaq has rebounded 4.7% while bitcoin fell another 3.1%: stocks lean on earnings, bitcoin on fund flows
- In South Korea, a steady won near 1,330-1,340 per dollar gives local holders almost no currency cushion
Bitcoin falls for a fifth straight week on a weekly-close basis. According to Yahoo Finance price history, bitcoin traded at about $73,620 at 10 p.m. ET on November 11, 2026 (noon on November 12 in Seoul), 14.2% below its October 5 close of $85,787. Over the same stretch the Nasdaq Composite lost 7.3% and gold futures 3.8%. All three faced the same headwinds, rising rate-hike bets and a firmer dollar, yet bitcoin dropped roughly twice as much as stocks. If you ask why bitcoin is down more than everything else, the single biggest answer is money leaving U.S. spot bitcoin ETFs.
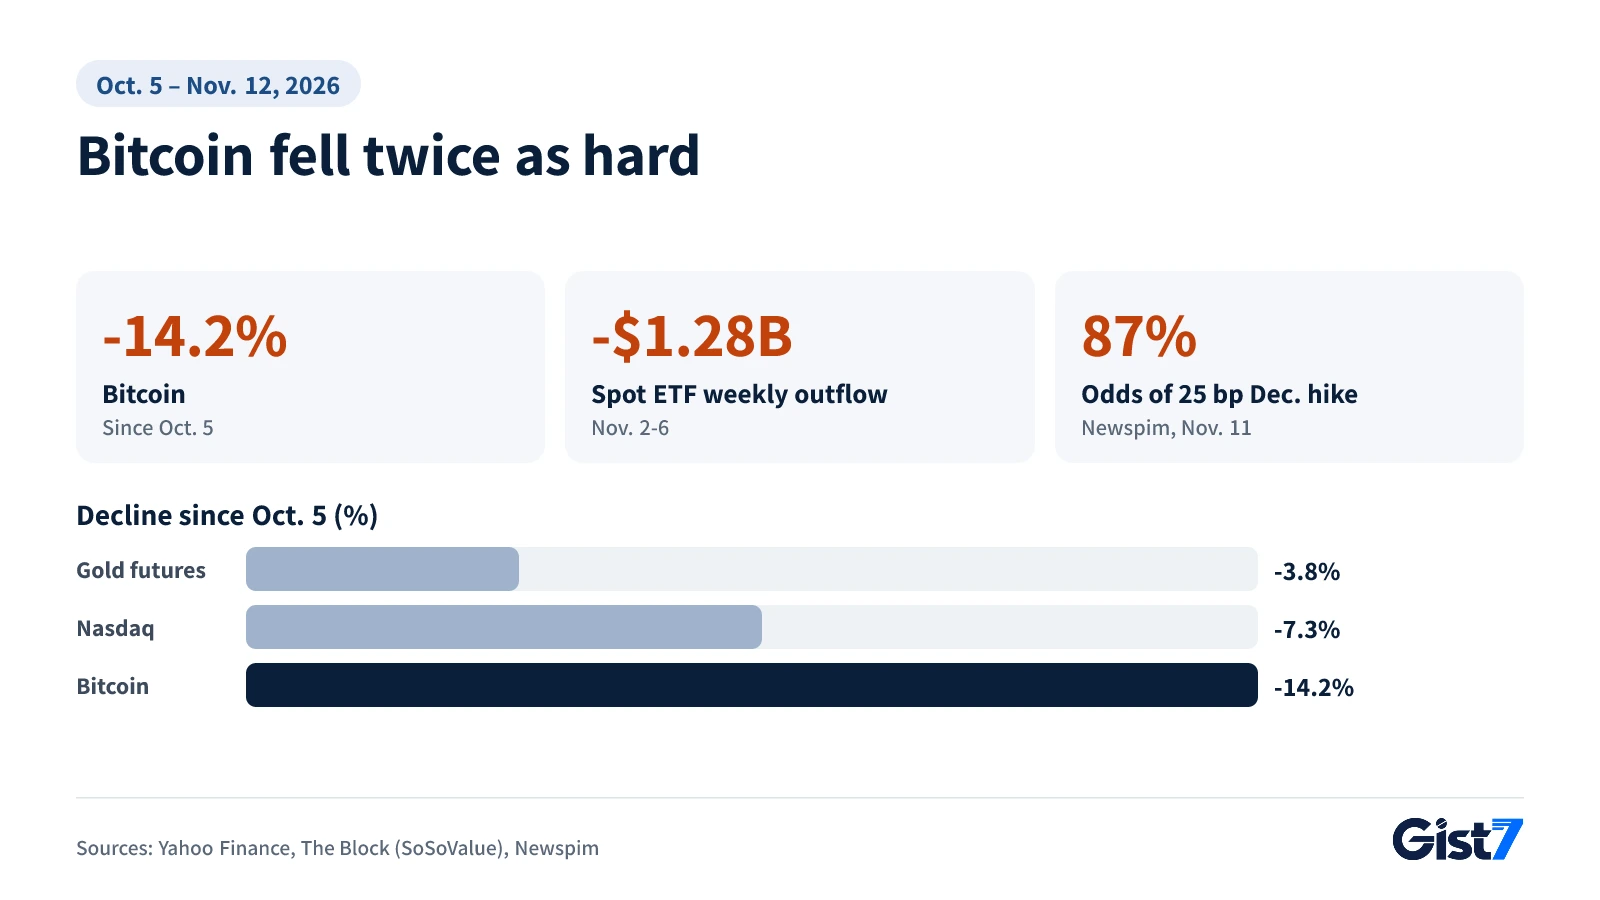
Bitcoin falls four times as far as gold, twice as far as the Nasdaq
Measured by Sunday weekly closes, bitcoin has fallen five weeks in a row, from the week ending October 11 through the week ending November 8. Yahoo Finance data show the weekly close sliding from $86,480 on October 4 to $74,585 on November 8 without a single up week in between. The current week, which began November 9, is also running lower so far: the November 12 price (Seoul time) sits below last week's close, though the weekly result will only be final after Sunday, November 15.
The table below starts from the October 5 (Monday) close so the dates line up with stocks and gold. That is one day later and roughly $700 lower than the weekly starting point (the Sunday, October 4 close). On that basis, a bitcoin vs. gold vs. Nasdaq comparison shows bitcoin's drop at about four times gold's and about twice the Nasdaq's.
| Asset | Oct 5 | Latest | Since Oct 5 | Since Nov 5 |
|---|---|---|---|---|
| Bitcoin | $85,787 | $73,620 (Nov 11, 10 p.m. ET) | -14.2% | -3.1% |
| Nasdaq Composite | 27,477.31 | 25,466.19 (Nov 11 close) | -7.3% | +4.7% |
| Gold futures (Dec.) | $4,156.80 | $4,000.50 (Nov 11) | -3.8% | -2.7% |
Sources: Yahoo Finance price history; Nov. 11 gold settlement from Newspim (COMEX December contract)
The split is sharper over the past week. After the tech selloff that followed the midterm elections on November 5, the Nasdaq climbed back 4.7% on a rebound powered by CoreWeave's earnings. Bitcoin slid another 3.1% over the same period. Stocks have earnings to lean on. Bitcoin produces no cash flow, so what supports its price in the end is the flow of buyers and sellers. Right now that flow is running the wrong way.
ETFs turn from on-ramp to exit: $1.28 billion out in one week
U.S. spot bitcoin ETFs posted $1.28 billion in net outflows during the week of November 2 to 6. It was the largest weekly outflow since late June, and it was enough to flip 2026's cumulative flows from a net inflow to a net outflow. The Block reported the figures on November 7, citing SoSoValue data. A spot bitcoin ETF is an exchange-traded fund that buys and holds actual bitcoin so its shares track the coin's price.
| Day (Nov 2-6) | Net flow |
|---|---|
| Mon | -$398.6 million |
| Tue | -$115.6 million |
| Wed | +$74.6 million |
| Thu | -$430.2 million |
| Fri | -$411.9 million |
| 2026 year to date | about +$368 million at the start of the week → about -$914.1 million at the end |
Source: The Block (SoSoValue data)
The 12 funds together hold $95.9 billion worth of bitcoin, about 6.3% of the coin's market capitalization. The largest, BlackRock (NYSE: BLK)'s iShares Bitcoin Trust (Nasdaq: IBIT), had $60.3 billion in net assets, less than the $65.1 billion of cumulative net inflows it has taken in since launch. Put simply, the fund is now worth less than the money that went into it, which suggests a good share of its holders may be sitting on losses on average. As losses deepen, some holders sell to cut them, and that selling can push the price lower again. Spot ether ETFs are bleeding too: six straight weeks of net outflows have left them down about $405.6 million for 2026, according to The Block.
Since their January 2024 launch, ETFs have been the biggest channel for new money flowing into bitcoin. When that channel turns into an exit, the same rate shock tends to hit bitcoin harder than it hits stocks.
Will a Fed rate hike push bitcoin lower?
A 25-basis-point hike in December is already largely priced in, so whether bitcoin falls further depends more on whether the hike grows to 50 basis points and on the path after that. According to Newspim, markets on November 11 (New York time) priced an 87% chance of a quarter-point hike in December, while the odds of a half-point move rose to 12.9% from 0% before the CPI release. The federal funds target range currently stands at 3.75% to 4.00% (Federal Reserve, FOMC statement of October 28).
Talk of a half-point move started with Fed Governor Christopher Waller, who said in a November 10 speech that the Fed should consider a 50-basis-point hike in December if core CPI came in around 0.3% or higher. The inflation numbers released that day and the Treasury market's reaction are covered in our U.S. October CPI explainer.
For bitcoin, the order of events matters. The heavy ETF outflows came during November 2 to 6, before the CPI release, and The Block tied them to a joint selloff in stocks and crypto after the midterm elections and to doubts about AI spending. The rate shock landed on a market whose buying power was already thinning.
Rates weigh on bitcoin through two channels. The first is opportunity cost. The price of holding an asset that pays no interest rises as Treasury yields climb, and the 10-year Treasury yield published by the U.S. Treasury stood at 4.98% on November 10. The second is the dollar. Hana Bank's FX Daily (November 12) reported that hawkish remarks by Fed officials pushed the dollar index toward 103, and Newspim said the index reached its highest level since April 2025. That is a burden for assets priced in dollars.
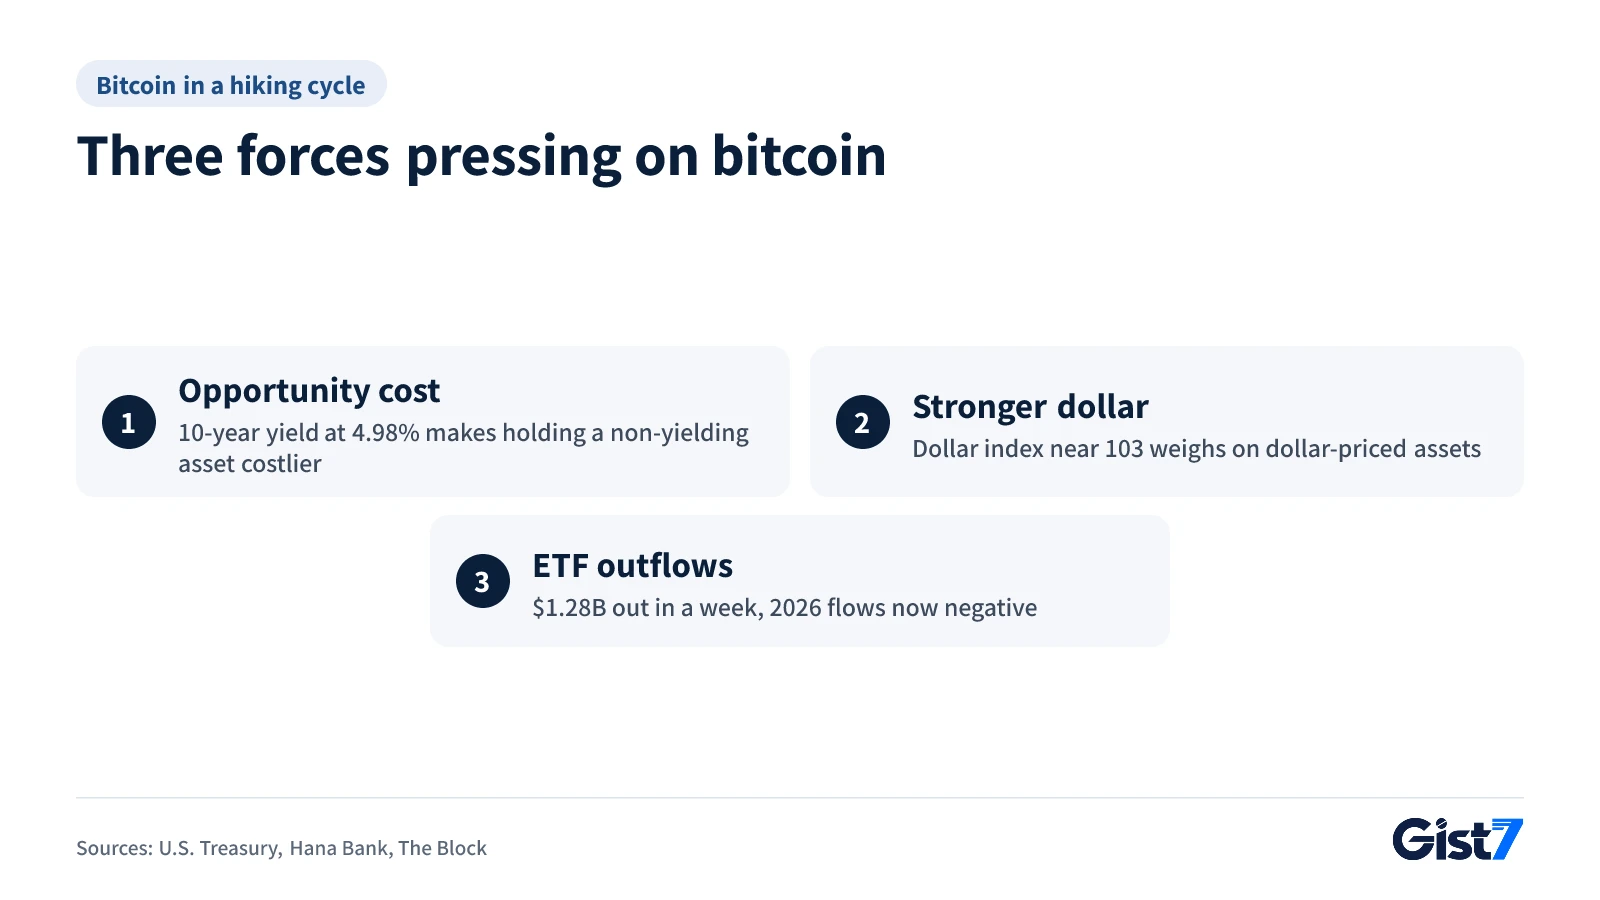
Here is how the scenarios connect. These are transmission channels, not price forecasts.
- 25 bp hike plus a gradual path afterward: This is the priced-in case, so ETF flows are more likely than rates to set the direction.
- 50 bp hike, or signals of more hikes next year: Treasury yields and the dollar could climb further and add to the downward pressure.
- A hike paired with a signal that this is close to the last one: Lifting the uncertainty could give bitcoin a reason to rebound.
Gold also pays no interest, but its smaller drop appears to reflect separate safe-haven demand that shows up in times of stress. Over these five weeks bitcoin has behaved more like a tech stock than like gold, and a more volatile one at that. In Gist 7's view, the first sign of a bottom is more likely to show up in ETF flows than in the price itself. Whether the daily flows tracked by SoSoValue turn to net inflows for several days in a row is a checkpoint as important as the rate decision.
Korean won offers local holders little cushion
For investors in South Korea, where crypto is mostly bought in won, the exchange rate is doing almost nothing to soften losses this time. According to Hana Bank's FX Daily (November 12), the won closed at 1,337.5 per dollar on November 11, stronger by 7.0 won, and the offshore non-deliverable forward (NDF) rate was 1,336.4. In other words, the won actually firmed on some days while bitcoin's dollar price was sliding.
In a typical risk-off market the dollar strengthens and the won weakens, which trims losses for won-based holders a little compared with dollar terms. This time the won held up even as the dollar index rose. Hana Bank pointed to strong Korean exports and dollar selling by exporters. As a result, losses in won terms can be roughly the same as in dollar terms, or slightly larger on days the won strengthens. Converting the November 12 midday price (Seoul time) at the NDF rate gives about 98.4 million won per bitcoin. Prices on Korean exchanges can differ because of the local premium known as the kimchi premium.
Market impact map
The table shows which assets moved with this bitcoin decline, in which direction, how strongly and why, with each link traced back to bitcoin.
| Asset / indicator | Direction | Strength | Link (why) |
|---|---|---|---|
| Bitcoin | ↓ | Strong | ETF outflows coincided with rate-hike bets; about $73,620 (Nov 11, 10 p.m. ET, Yahoo Finance) |
| Ether | ↓ | Medium | Spot ether ETFs saw six straight weeks of net outflows; about -$405.6 million year to date (The Block) |
| 2-year Treasury | ↑ | Medium | The first rate to price in a December hike; the higher it goes, the heavier the load on bitcoin. 4.73% (Nov 10, U.S. Treasury) |
| 10-year Treasury | ↑ | Medium | The higher it goes, the costlier it is to hold non-yielding bitcoin. 4.98% (Nov 10, U.S. Treasury) |
| Dollar index | ↑ | Medium | The higher it goes, the heavier the load on dollar-priced bitcoin. Near 103 (Hana Bank, Nov 12) |
| Gold | ↓ | Weak | Same rate pressure, but the drop was limited, apparently by safe-haven demand; -3.8% since Oct 5 |
| Nasdaq | ↑↓ conditional | Weak | Same rate pressure, offset by AI earnings; +1.60% on Nov 11 (Yahoo Finance) |
Little direct impact: USD/KRW (in the 1,330s; strong exports muted the dollar's rise), oil (WTI), S&P 500, KOSPI
- Crypto holders outside the U.S.: when the local currency does not weaken against the dollar, the drop in bitcoin's dollar price passes almost one-for-one into local-currency prices, as it does in Korea now.
- Borrowing costs: a 10-year Treasury yield near 5% can push up long-term market rates elsewhere, raising the cost of fixed-rate loans.
- Travel and overseas payments: with USD/KRW stuck in the 1,330s, the cost of dollar payments for Korean consumers has barely changed.
Market reactions can vary with other factors, and this table is not a basis for investment decisions.
What to watch next
| Date (ET) | Indicator / event | Previous | Why it matters here | If it comes in… |
|---|---|---|---|---|
| Each U.S. trading day (tallied after the close) | Daily net flows into U.S. spot bitcoin ETFs (SoSoValue) | -$1.28 billion for the week of Nov 2-6 (The Block) | The most direct driver of this slide | Several days of inflows would signal improving demand; continued outflows tend to keep pressure on |
| Nov 13 (Fri) 8:30 a.m. | U.S. October Producer Price Index (PPI) | September +1.3% m/m (BLS) | Whether the case for a 50 bp hike gains ground | Hotter: yields and dollar ↑, tends to weigh on bitcoin |
| Nov 25 (Wed) 8:30 a.m. | U.S. October PCE prices (BEA) | September 3.6% y/y (BEA) | The Fed's preferred inflation gauge | Above expectations could intensify debate over the size of the hike |
| Dec 4 (Fri) 8:30 a.m. | U.S. November jobs report | October nonfarm payrolls +165,000, unemployment 4.1% (BLS) | Whether the economy can absorb more hikes | Strong jobs keep the hiking path; weak jobs could revive hopes of a slower pace and ease pressure on risk assets |
| Dec 9 (Wed) 2:00 p.m. | FOMC rate decision (Dec 8-9 meeting) | 3.75%-4.00% (Fed) | The turning point for both the rate path and ETF flows | 50 bp: yields and dollar ↑; a last-hike signal could ease uncertainty |
Frequently asked questions
Why is bitcoin down so much?
Money has been leaving U.S. spot bitcoin ETFs, and a hotter-than-expected October CPI raised expectations of a December Fed rate hike. In the first week of November alone, $1.28 billion flowed out, turning 2026's cumulative flows negative (The Block). A dollar index approaching 103 adds to the pressure.
Does bitcoin always fall when the Fed raises rates?
No. According to Newspim, markets on November 11 already priced an 87% chance of a quarter-point December hike, so the size of the move and the path afterward matter more than the decision itself. A half-point hike or hints of more hikes could weigh on bitcoin, while a signal that this is close to the last hike could reduce uncertainty.
How much money has left bitcoin ETFs?
According to The Block, citing SoSoValue data, U.S. spot bitcoin ETFs saw $1.28 billion in net outflows from November 2 to 6, the most since late June. Year-to-date flows swung from about $368 million in net inflows to about $914.1 million in net outflows.
Gold fell too, so why did bitcoin fall more?
Neither pays interest, so both suffer when yields rise, but gold appears to have been cushioned by safe-haven demand. Since October 5, gold futures are down 3.8% while bitcoin is down 14.2%, meaning bitcoin traded like a tech stock this time, only with bigger swings.
Does a weaker dollar help investors who buy bitcoin in Korean won?
Not this time. The won closed at 1,337.5 per dollar on November 11, with the offshore NDF at 1,336.4 (Hana Bank), so bitcoin's dollar decline passed almost fully into won prices. Prices on Korean exchanges can also differ from a simple conversion because of the kimchi premium.
References
- Bitcoin ETFs flip negative for 2026 after $1.28 billion outflow week, worst since June — The Block
- The Economic Outlook and Some Thoughts on Labor Market Dynamism (Waller, 2026-11-10) — Federal Reserve
- Federal Reserve issues FOMC statement (2026-10-28) — Federal Reserve
- Daily Treasury Par Yield Curve Rates (2026년 11월) — 미 재무부
- Hana FX Daily Letter (2026년 11월 12일) — 하나은행
- 뉴욕 금·유가 마감 (2026년 11월 12일) — 뉴스핌
- Bitcoin USD (BTC-USD) Historical Data — Yahoo Finance
- Schedule of Releases for the Producer Price Index — BLS
- Schedule of Releases for the Employment Situation — BLS
- Release Schedule — 미 경제분석국(BEA)