What Is the Dollar Index (DXY)? A Gauge That's 57.6% Euro
Key summary
The dollar index (DXY) tracks the dollar against six currencies (March 1973 = 100). On Nov. 20, 2026 (Seoul afternoon), it was 103.730, per BetaNews. The euro is 57.6% and the won is excluded, so they don't always move together. For all U.S. trade, see the Fed's trade-weighted dollar index too.
- The dollar index was built in March 1973 on the currencies of major U.S. trading partners (= 100); today ICE calculates it every second as a weighted geometric mean of six exchange rates
- The weights are fixed: euro 57.6%, yen 13.6%, pound 11.9%. They have changed only once, when the euro launched in 1999
- The Korean won, Chinese yuan and Mexican peso are not in the index, so its six currencies cover only 47.8% of U.S. trade (Fed 2026 weights)
- Because the won sits outside the index, it can weaken on a day the DXY falls. Example: on Nov. 20, 2026, the DXY slipped 0.221 from the previous session, yet the won-dollar rate rose 6.2 won as foreign investors sold Korean stocks
- A stronger dollar usually weighs on emerging-market dollar debt, dollar-priced commodities and the earnings of U.S. multinationals
The U.S. dollar index (DXY) measures the value of the dollar against six currencies: the euro, Japanese yen, British pound, Canadian dollar, Swedish krona and Swiss franc, with March 1973 set at 100. A rising index means a stronger dollar; a falling one means a weaker dollar. On the afternoon of November 20, 2026, Seoul time, it stood at 103.730, according to Korean outlet BetaNews. That leaves the dollar about 3.7% stronger against the six currencies than at its starting point 53 years ago. But 57.6% of the index rides on a single currency, the euro, and the Korean won, Chinese yuan and Mexican peso are not in it at all. That is why the won-dollar exchange rate does not rise one-for-one with the dollar index.
What is the dollar index? 100 is the baseline, and higher means a stronger dollar
The dollar index sums up in one number whether the dollar has gained or lost ground against the major developed-market currencies. Above 100, the dollar is stronger than in March 1973; below 100, it is weaker. Today the index is calculated by exchange operator Intercontinental Exchange (NYSE: ICE). According to ICE, the index launched in March 1973. It was built on the currencies of the major U.S. trading partners of the time, and the Federal Reserve is generally credited with creating it. That was when the fixed exchange-rate system ended and the dollar began to float freely.
Take November 2026 as an example. The index was trading at levels it had not reached in more than a year and a half. It set a 19-month high on November 13 (our recap of the won that week) and climbed further to an intraday 103.970 on the 19th. On the afternoon of the 20th, Seoul time, it was at 103.730, down 0.221 from the previous session, BetaNews reported.
Yet on that same day the won weakened. The won-dollar rate is quoted in won per dollar, so a higher number means a weaker won. As of 3:30 p.m. Seoul time on the 20th, it was 1,336.2 won, up 6.2 won. According to BetaNews, foreign investors net sold 1.132 trillion won of shares on Korea's main KOSPI market, dragging the won lower. That came after a sharp drop in U.S. chip stocks the night before. The index fell, but the won weakened. The dollar index simply does not measure the dollar against the won, and that is the first thing to keep in mind when reading it. Separately from the won's move, later that day in New York (early on November 21 in Seoul), the Nasdaq fell more than 5%.
How is the dollar index calculated? A weighted geometric mean of six currencies
Calculating the dollar index means raising six exchange rates to fixed weights and multiplying them together, a method known as a weighted geometric mean. According to ICE's methodology, the formula is as follows, with every rate entered as the amount of foreign currency one dollar buys.
DXY = 50.14348112 × (euros per dollar)^0.576 × (yen per dollar)^0.136 × (pounds per dollar)^0.119 × (Canadian dollars per dollar)^0.091 × (kronor per dollar)^0.042 × (francs per dollar)^0.036
The constant 50.14348112 at the front scales the index so that March 1973 equals 100. Per the ICE methodology, the index is calculated every second, from 7:45 p.m. ET the previous day to 7:15 p.m. ET on the current day.
The weights reveal the character of the index. In the table below, the left column shows the currencies and weights published by ICE, and the right column shows the trade weights the Fed set on February 2, 2026.
| Currency | Dollar index (DXY) weight | Fed broad dollar index weight (2026) |
|---|---|---|
| Euro | 57.6% | 21.0% |
| Japanese yen | 13.6% | 5.2% |
| British pound | 11.9% | 5.2% |
| Canadian dollar | 9.1% | 12.8% |
| Swedish krona | 4.2% | 0.6% |
| Swiss franc | 3.6% | 3.0% |
| Mexican peso | Not included | 14.8% |
| Chinese yuan | Not included | 10.9% |
| Korean won | Not included | 3.6% |
Sources: ICE methodology; Fed H.10 trade weights. Fed weights are rounded to one decimal place.
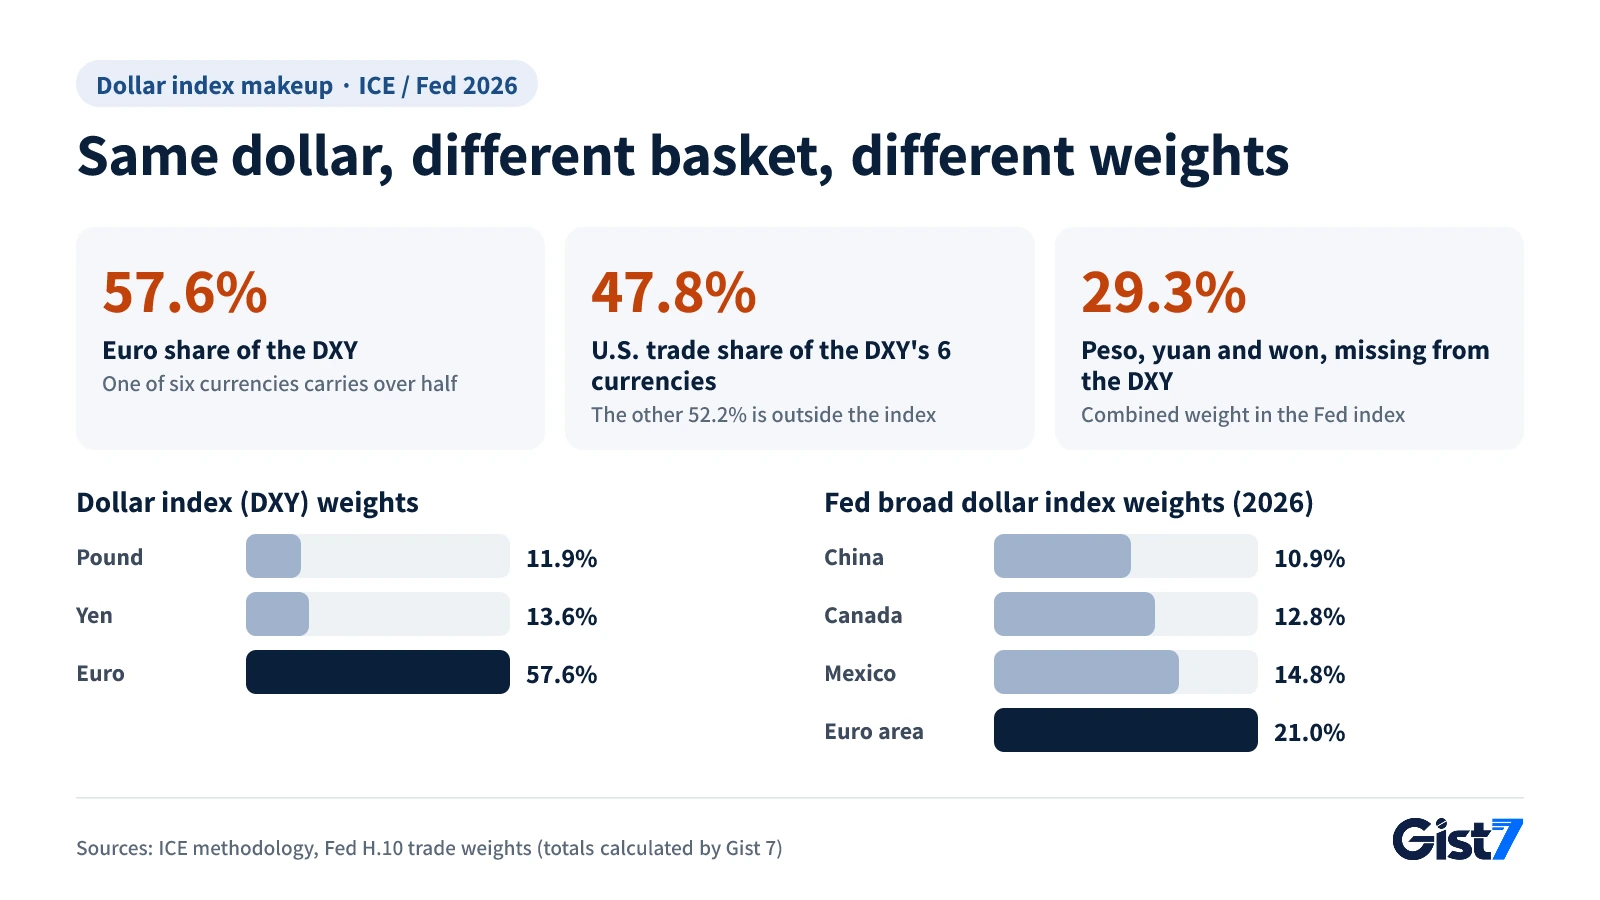
A 57.6% euro weight means that if the euro weakens 1% against the dollar while every other currency holds still, the dollar index rises about 0.58% (1.01 raised to the power of 0.576, Gist 7 calculation). If the won weakens 1%, the index does not move at all. According to ICE, the weights have changed only once since 1973. When the euro launched in January 1999, it replaced the German mark, French franc and other European currencies, and inherited their combined weight of 57.6% unchanged.
Highs and lows since 1973
| Date | Dollar index | Note |
|---|---|---|
| March 1973 | 100.000 | Starting point (ICE) |
| February 1985 | 164.72 | All-time high (ICE) |
| March 2008 | 70.698 | All-time low (ICE) |
| November 20, 2026 | 103.730 | Afternoon, Seoul time (BetaNews) |
The high is more than double the low. In September 1985, months after the peak, major economies agreed in the Plaza Accord to push the dollar down together. Against that long history, the 103 range of November 2026 sits a little below the middle (about 117.7, halfway between 70.698 and 164.72).
DXY vs. the trade-weighted dollar index: what's the difference?
To gauge the dollar's overall value, the Fed's Nominal Broad U.S. Dollar Index is more accurate. It is a trade-weighted dollar index that bundles 26 currencies (the euro area plus 25 countries) by their share of U.S. trade, and its weights are reset every year. Measured with the Fed's trade weights, the six DXY currencies add up to only 47.8% (Gist 7 calculation). In other words, more than half of U.S. trade lies outside the DXY.
| Item | Dollar index (DXY) | Fed broad dollar index |
|---|---|---|
| Calculated by | ICE (index built in March 1973 on major U.S. trading partners' currencies) | Fed H.10 release |
| Currencies | 6 | 26 |
| Weights | Based on 1973 trade, fixed | Share of U.S. trade, updated yearly |
| Base | March 1973 = 100 | January 2006 = 100 |
| Updates | Every second | One value per day, published weekly |
| Latest value | 103.730 (Nov. 20, afternoon Seoul time) | 122.6503 (Nov. 13) |
The two often diverge within a single week. Comparing November 9 and 13 in the H.10 release the Fed published on November 16 (there is no data for the 11th, a U.S. holiday), the broad dollar index rose 0.81%. Broken down, the index against advanced foreign economies (AFE) gained 1.41%, while the index against emerging market economies (EME) rose just 0.24%. Over the same period, the won-dollar rate (New York noon buying rate) fell 0.59%, from 1,344.55 to 1,336.58 won, meaning the won strengthened (all Gist 7 calculations). That week's dollar strength was concentrated in the developed-market currencies that the DXY weights most heavily.
When the dollar index rises: the won, emerging markets, commodities and U.S. stocks
When the dollar index rises, other markets usually show four tendencies. They are only tendencies; depending on why the dollar rose, plenty of days go the other way.
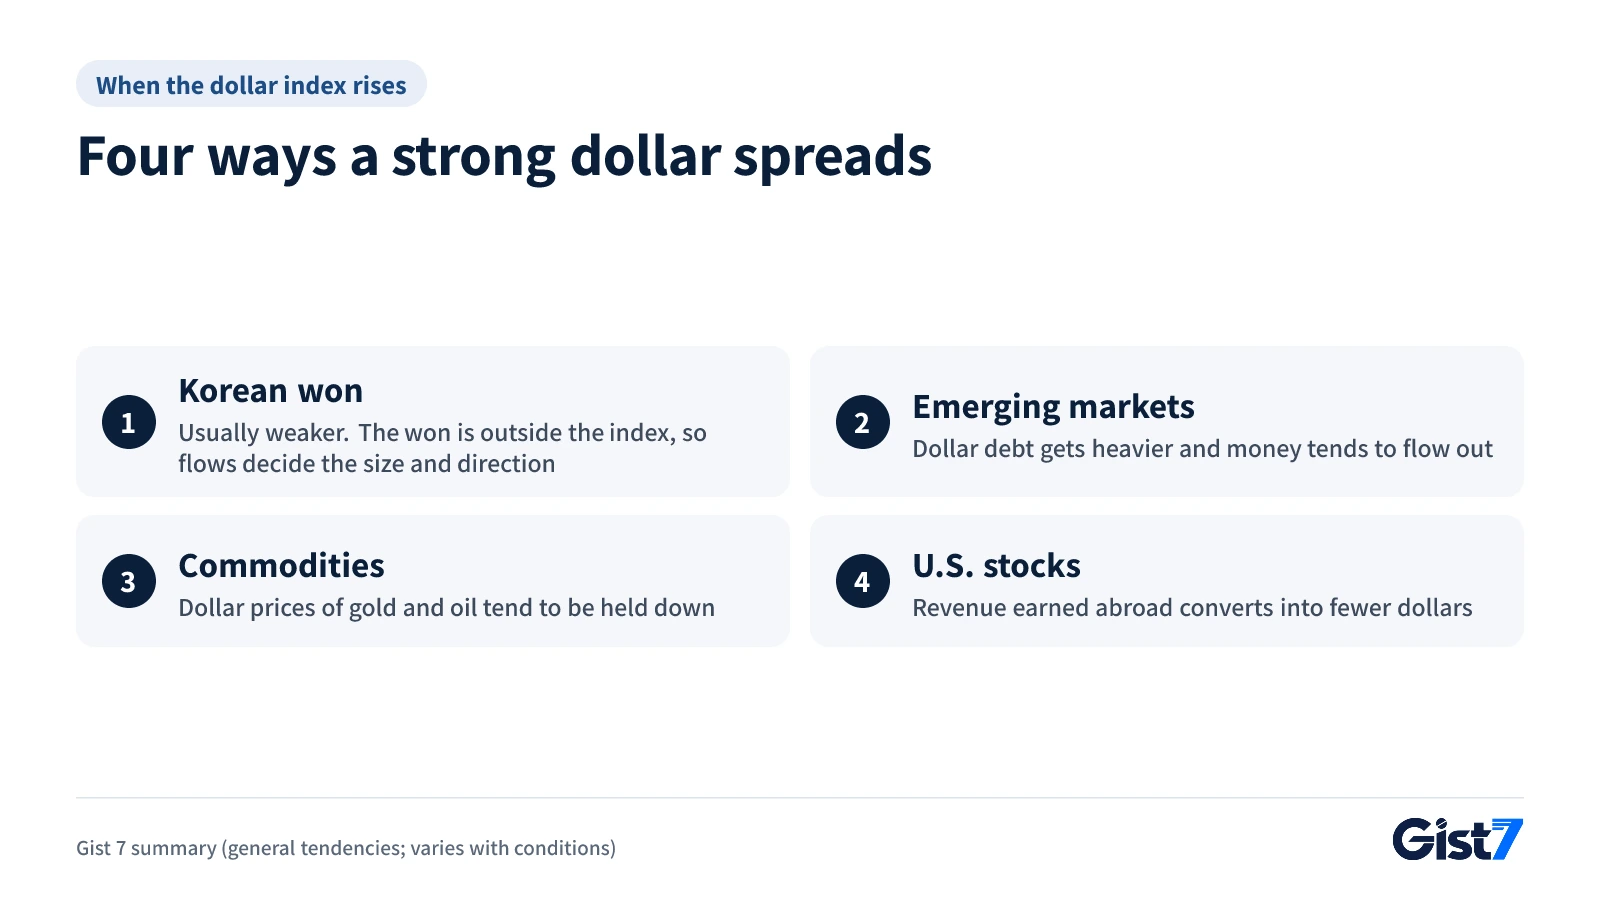
The won: often the same direction, but a different size. The dollar index and the won-dollar rate tend to rise together, because the forces that lift the dollar, such as higher U.S. rates or risk aversion, also hurt the won. But the won is not in the index, so the yen and yuan, exporters' dollar sales and foreign trading in Korean stocks all pull on it separately. As the two examples above show, the direction sometimes splits.
Emerging markets: heavier dollar debt. Emerging-market governments and companies that borrowed in dollars need more of their own currency to repay as the dollar strengthens. That is why money tends to leave emerging-market stocks and bonds when the dollar is strong. This pressure is better tracked with the Fed's EME index than with the DXY, which holds no emerging-market currency.
Commodities: dollar prices under pressure. Gold, oil and copper are mostly priced in dollars. A stronger dollar makes the same commodity more expensive for buyers using other currencies, which can cut demand and push dollar prices lower. Gold, which pays no interest, takes a bigger hit when U.S. rates rise at the same time. We covered that link, along with real interest rates, in our analysis of gold's drop to a more-than-one-year low. For oil, supply decisions by producing countries often matter more.
U.S. stocks: multinationals' profits look smaller. Revenue earned abroad in euros or yen shrinks when it is converted into a stronger dollar. On days when the dollar rises on risk aversion, though, it is the risk aversion itself, more than the exchange rate, that drags shares lower.
Gist 7's take: the dollar index is closer to a "dollar vs. euro" gauge. To see what actually reaches the won and your own portfolio, it is more accurate to check three things together. First, whether the Fed's broad dollar index and its EME index point the same way. Second, whether the won's rates against the yen and yuan move with the won-dollar rate. Third, whether foreign investors are buying or selling Korean stocks. Pressure for a weaker won is greatest when all three point toward the dollar.
Market impact map: what usually happens when the dollar index rises
The starting point is a rising dollar index. When U.S. interest rates climb above those of other developed economies, or demand for safe assets grows, the dollar index goes up, and other assets usually show the tendencies below.
| Asset / indicator | Direction | Strength | Link (why) |
|---|---|---|---|
| Euro (vs. dollar) | ↓ | Strong | At 57.6% of the index, most of a DXY rise shows up as euro weakness |
| Yen (vs. dollar) | ↓ | Medium | 13.6% weight; the yen tends to weaken more as the U.S.-Japan rate gap widens |
| Won-dollar rate (won per dollar) | ↑ | Medium | The won is outside the index, linked indirectly through a weaker yen and yuan and foreign outflows |
| Gold | ↓ | Medium | Priced in dollars, so it costs more for holders of other currencies; as a non-yielding asset, it suffers more when rates also rise |
| KOSPI (Korea's benchmark stock index) | ↓ | Medium | When the won weakens, foreign investors tend to net sell, wary of currency losses |
| Emerging-market currencies and bonds | ↓ | Medium | Heavier dollar debt payments and a tendency for money to flow out |
Little direct impact: 2-year Treasury, 10-year Treasury, Nasdaq, S&P 500, oil (WTI), bitcoin (Treasury yields sit closer to the cause of dollar index moves; the Nasdaq and S&P 500 are more sensitive to rates and earnings outlooks than to exchange rates; oil is often driven more by producer supply, and bitcoin by liquidity)
- Currency exchange for Koreans traveling abroad: if the won-dollar rate rises too, it takes more won to buy the same dollars. At 1,336.2 won as of 3:30 p.m. Seoul time on November 20, $1,000 comes to about 1,336,000 won (bank rates differ because of fees).
- Overseas stocks and dollar deposits held by Korean investors: even if the dollar price stays put, a higher won-dollar rate raises their value in won.
- Import prices in Korea: even if dollar prices for oil and grain fall, a weaker won shrinks the drop in domestic import prices.
Market reactions can vary with other factors, and this table is not a basis for investment decisions.
What to watch next
| Date (ET) | Indicator / event | Previous | Why it matters here | If it comes in... |
|---|---|---|---|---|
| Nov. 25 (Wed) 8:30 a.m. | U.S. October PCE price index | September: 3.6% y/y (BEA) | Shifts the Fed rate outlook and the appeal of dollar yields | Hotter: hike expectations up, DXY tends to rise |
| Nov. 26 (Thu, Seoul) | Bank of Korea base rate decision | Held at 3.00% (BOK October minutes) | Directly tied to the U.S.-Korea rate gap and the won-dollar rate | A hike would support the won; a hold keeps the rate gap |
| Dec. 4 (Fri) 8:30 a.m. | U.S. November jobs report | October nonfarm payrolls +165,000, unemployment 4.1% (BLS) | Last jobs data before the December FOMC | Strong jobs: dollar tends to rise; sharp cooling: dollar tends to fall |
| Dec. 9 (Wed) 2:00 p.m. | FOMC rate decision and projections (Dec. 8-9 meeting) | Target range 3.75-4.00% (Fed) | The U.S. rate path, the biggest driver of the dollar index | A hike plus signals of more: dollar up; signals of a slower pace: dollar down |
| Dec. 17 (Thu) 8:15 a.m. | European Central Bank (ECB) policy decision | Deposit rate 2.50% (ECB) | Sets the direction of the euro, 57.6% of the index | Hawkish ECB: euro up, DXY tends to fall |
Frequently asked questions
What does a dollar index reading of 100 mean?
It means the dollar is at the same level as in March 1973. The index sets that month at 100 and compares the dollar against six currencies. The reading of 103.730 on the afternoon of Nov. 20, 2026, Seoul time (reported by BetaNews), means the dollar was about 3.7% stronger than back then.
Is the Korean won in the dollar index?
No. According to ICE's methodology, the index holds only six currencies: the euro, yen, pound, Canadian dollar, Swedish krona and Swiss franc. For a dollar index that includes the won, look at the Fed's broad dollar index, where the won's weight is 3.6% in 2026.
Do the dollar index and the won-dollar exchange rate always move together?
Usually in the same direction, but not always. On Nov. 20, 2026, the dollar index fell 0.221 from the previous session, while the won-dollar rate rose 6.2 won as foreign investors net sold Korean shares. Because the won is not in the index, it also reacts separately to local flows and to moves in the yen and yuan.
Should I watch the DXY or the Fed's trade-weighted dollar index?
They do different jobs. The DXY updates every second and has futures and options, which makes it good for tracking market reactions in real time. The Fed's broad dollar index bundles 26 currencies by actual trade weights and gives a more accurate picture of the dollar's overall strength. It also captures the effect on emerging markets and the won better.
Why does gold tend to fall when the dollar index rises?
Because gold is priced in dollars. A stronger dollar makes gold more expensive for buyers who use other currencies, which can cut demand and push the dollar price lower. When U.S. rates rise at the same time, holding a metal that pays no interest becomes even less attractive. In a crisis, though, the two sometimes rise together.
Where can I check the dollar index?
For live readings, see the dollar index page of ICE, which calculates the index, and quotes for U.S. Dollar Index futures (symbol DX) listed on ICE Futures U.S. For the broad dollar index that also covers the won and yuan, the Fed's weekly H.10 foreign exchange release lists values by date.
References
- ICE FX Indexes Methodology (DXY components, weights and formula) — ICE
- U.S. Dollar Index (USDX): product and history — ICE
- Foreign Exchange Rates H.10: Total Trade Weights (2026) — Federal Reserve
- Foreign Exchange Rates H.10, November 16, 2026 — Federal Reserve
- KOSPI and KOSDAQ both plunge 5%, won nears 1,340 per dollar as foreigners net sell 1.3 trillion won — BetaNews (Korean, 2026-11-20)