Why Stocks Fall When Interest Rates Rise: 3 Channels
Key summary
Stocks fall when interest rates rise through a higher discount rate, heavier interest costs and money moving into Treasuries. Growth stocks are most sensitive, yet the Nasdaq rose in 2004-2006. As of Nov. 13, 2026, the 10-year yield was 5.15% and the real yield 2.91%.
- If the discount rate rises from 4% to 5%, the present value of $100 received in 30 years falls 25% (Gist 7 calculation)
- A Fed paper by Bernanke and Kuttner links a surprise 0.25-point rate cut to a roughly 1% rise in stock prices
- Growth stocks and REITs swing the most, value stocks less, and banks are mixed
- The Nasdaq rose 5.7% in the 2004-2006 hiking cycle but fell 33.1% in 2022, when real yields jumped 2.6 points (FRED)
- Of the 0.27-point rise in the 10-year yield on Nov. 9-13, 2026, 0.25 points came from real yields
If the discount rate rises from 4% to 5%, $100 you will receive in 30 years is worth 25% less today (Gist 7 calculation). That single calculation goes a long way toward explaining why stocks fall when interest rates rise. Higher rates raise the discount rate used to turn future profits into today's value, they increase interest costs for companies and consumers, and they make the fixed yield on Treasuries more attractive, pulling money out of stocks and into bonds. Not every stock falls by the same amount, though. Growth stocks whose profits lie far in the future swing the most, and there have been periods when rates rose because the economy was strong and stocks rose with them.
Why do stocks fall when interest rates rise? Three channels
The discount rate: the same profits are worth less
A stock price is the value today of the cash a company is expected to earn in the future, so when the discount rate goes up, the theoretical value of the stock falls even if the earnings outlook is unchanged. The discount rate is the rate used to convert future money into present value. Think of it as the Treasury yield plus an extra return for the risk of owning stocks.
A rise of just 1 percentage point, from 4% to 5%, cuts the value of distant cash flows sharply (Gist 7 calculation, simple compounding).
| When you receive $100 | Present value at 4% | At 5% | Change |
|---|---|---|---|
| In 1 year | $96.15 | $95.24 | -1.0% |
| In 10 years | $67.56 | $61.39 | -9.1% |
| In 20 years | $45.64 | $37.69 | -17.4% |
| In 30 years | $30.83 | $23.14 | -25.0% |
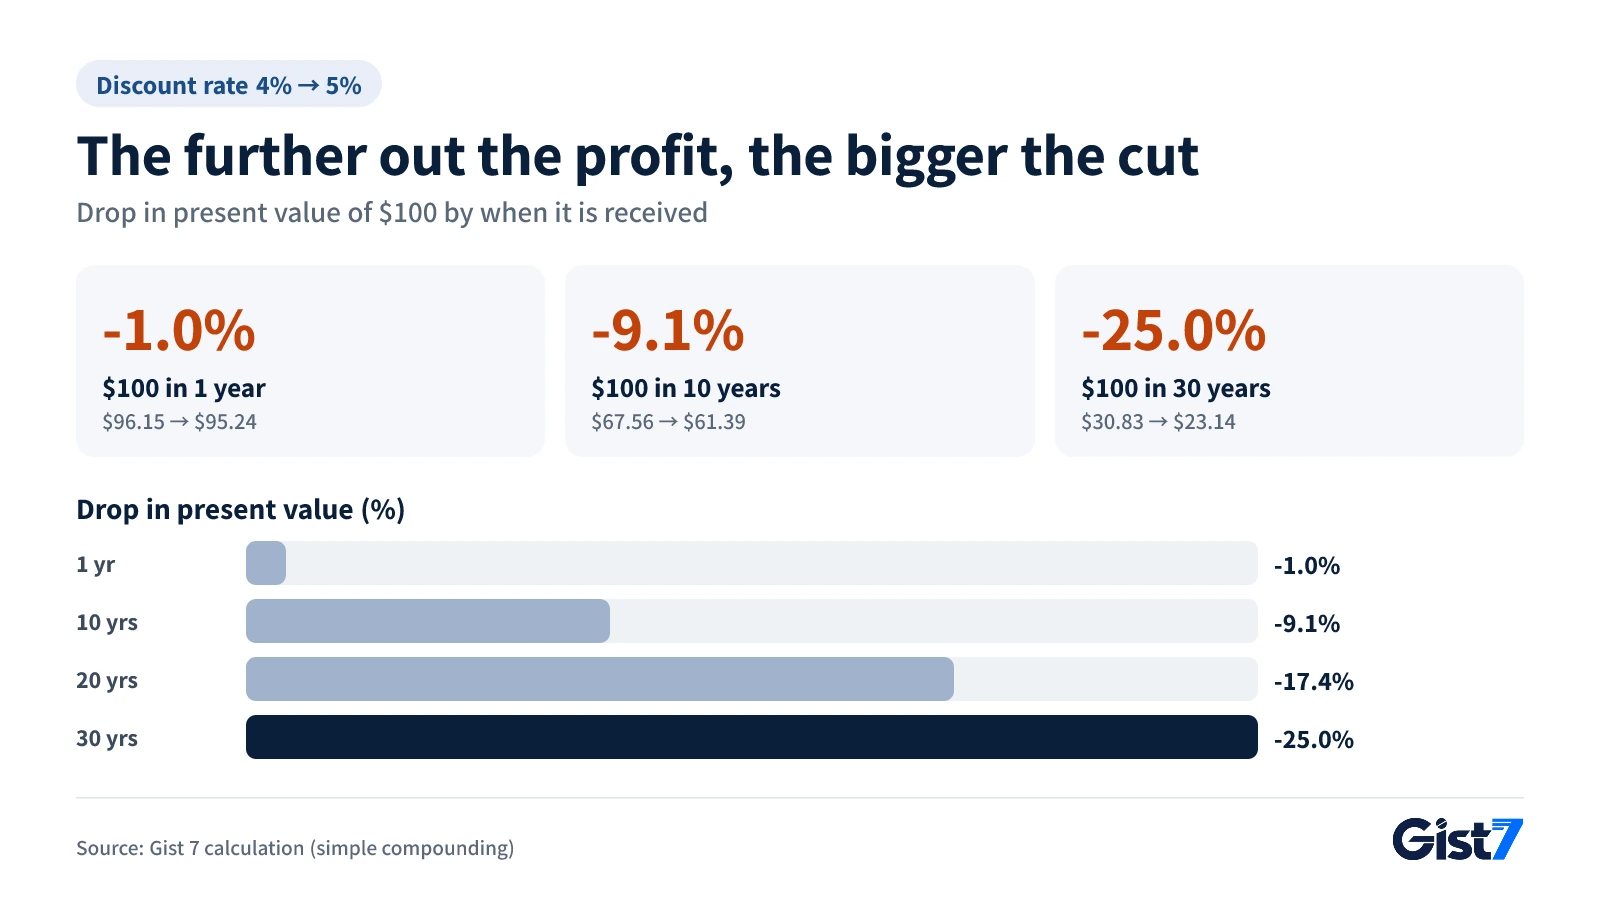
Tech and biotech companies whose value rests on profits 10 or 20 years out sit near the bottom rows of the table. Companies that already earn steady profits sit near the top. That is why stocks with a high price-to-earnings ratio (P/E) tend to be more sensitive to rates.
According to a 2004 Fed paper by Ben Bernanke and Kenneth Kuttner, using data from 1989 to 2002, an unexpected 0.25-point cut in the federal funds rate target was associated with roughly a 1% rise in broad U.S. stock indexes. The largest part of that reaction was explained not by the interest rate itself but by changes in the extra return investors demand to hold stocks, known as the equity risk premium. Read the other way, a surprise hike tends to make investors more demanding and pushes the discount rate up a second time.
Earnings: interest costs and slower spending
Over time, higher rates can also shrink profits themselves. Heavily indebted companies have to refinance floating-rate loans and maturing bonds at higher rates, so interest expense rises. The Fed explains that lower rates reduce rates on consumer loans and encourage spending. Hikes work in reverse: when car loans and mortgages get more expensive, company sales can suffer. The discount-rate effect shows up in stock prices on the day of an announcement, while lower earnings are confirmed over several quarters of results.
Money moving: when Treasuries pay 5%
When Treasury yields rise, the return available without risk goes up, and the case for holding stocks weakens in relative terms. The Fed itself notes in its explainer on monetary policy that changes in interest rates tend to affect stock prices by changing the relative attractiveness of equities. According to the U.S. Treasury, the 10-year yield was 5.15% on Nov. 13, 2026, and the 10-year real yield (the yield on Treasury Inflation-Protected Securities) was 2.91%. The real yield is the nominal yield minus expected inflation, the true reward left after beating inflation.
The earnings yield, the inverse of the P/E ratio, makes the comparison easy. A stock trading at 25 times earnings has an earnings yield of 4%, below the 5% on the 10-year Treasury, so an investor needs to believe profits will grow quickly to choose that stock. The higher rates go, the higher that bar becomes. This is a simple comparison, however. Corporate earnings can grow with inflation, so some analysts argue the right benchmark is the real yield (2.91% on Nov. 13). The same logic explains why gold, which pays no interest, weakens when real yields rise (our piece on gold and real yields).
Do all stocks fall the same? Growth, value and banks
No. Sectors whose profits lie far ahead or that carry heavy debt swing the most, while those with strong current profits, or that earn more when rates rise, hold up better. According to Yahoo Finance, on Nov. 13, 2026, when the 10-year yield climbed to 5.15%, the Nasdaq fell 0.91% while the Dow Jones Industrial Average rose 0.10%. The difference in tech weighting sent the two indexes in opposite directions on the same day.
| Type | Tendency when rates rise | Why |
|---|---|---|
| Growth stocks (tech, biotech) | Fall more | Profits sit far in the future, so the discount rate matters more |
| Value stocks (steady earners) | Fall less | More of the value comes from current profits, lower P/E |
| High-dividend stocks, REITs, utilities | Under pressure | Dividends compete with bond yields; REITs and utilities carry heavy debt |
| Banks | Mixed | Lending margins can widen, but the risk of bad loans rises too |
When do stocks rise even as rates climb? 2004-2006 vs. 2022
Whether stocks hold up when rates rise depends on why rates are rising and how fast. Putting two Fed hiking cycles side by side using FRED data makes the difference clear.
| Item (month-end / year-end) | June 2004 → June 2006 | Dec. 2021 → Dec. 2022 |
|---|---|---|
| Fed funds target | 1.25% → 5.25% | Upper bound 0.25% → 4.50% |
| 10-year Treasury yield | 4.62% → 5.15% (+0.53 pt) | 1.52% → 3.88% (+2.36 pts) |
| 10-year real yield | 2.10% → 2.54% (+0.44 pt) | -1.04% → 1.58% (+2.62 pts) |
| Nasdaq Composite | 2,055.65 → 2,172.09 (+5.7%) | 15,644.97 → 10,466.48 (-33.1%) |
Source: FRED (Federal Reserve H.15, Nasdaq); percentage changes calculated by Gist 7.
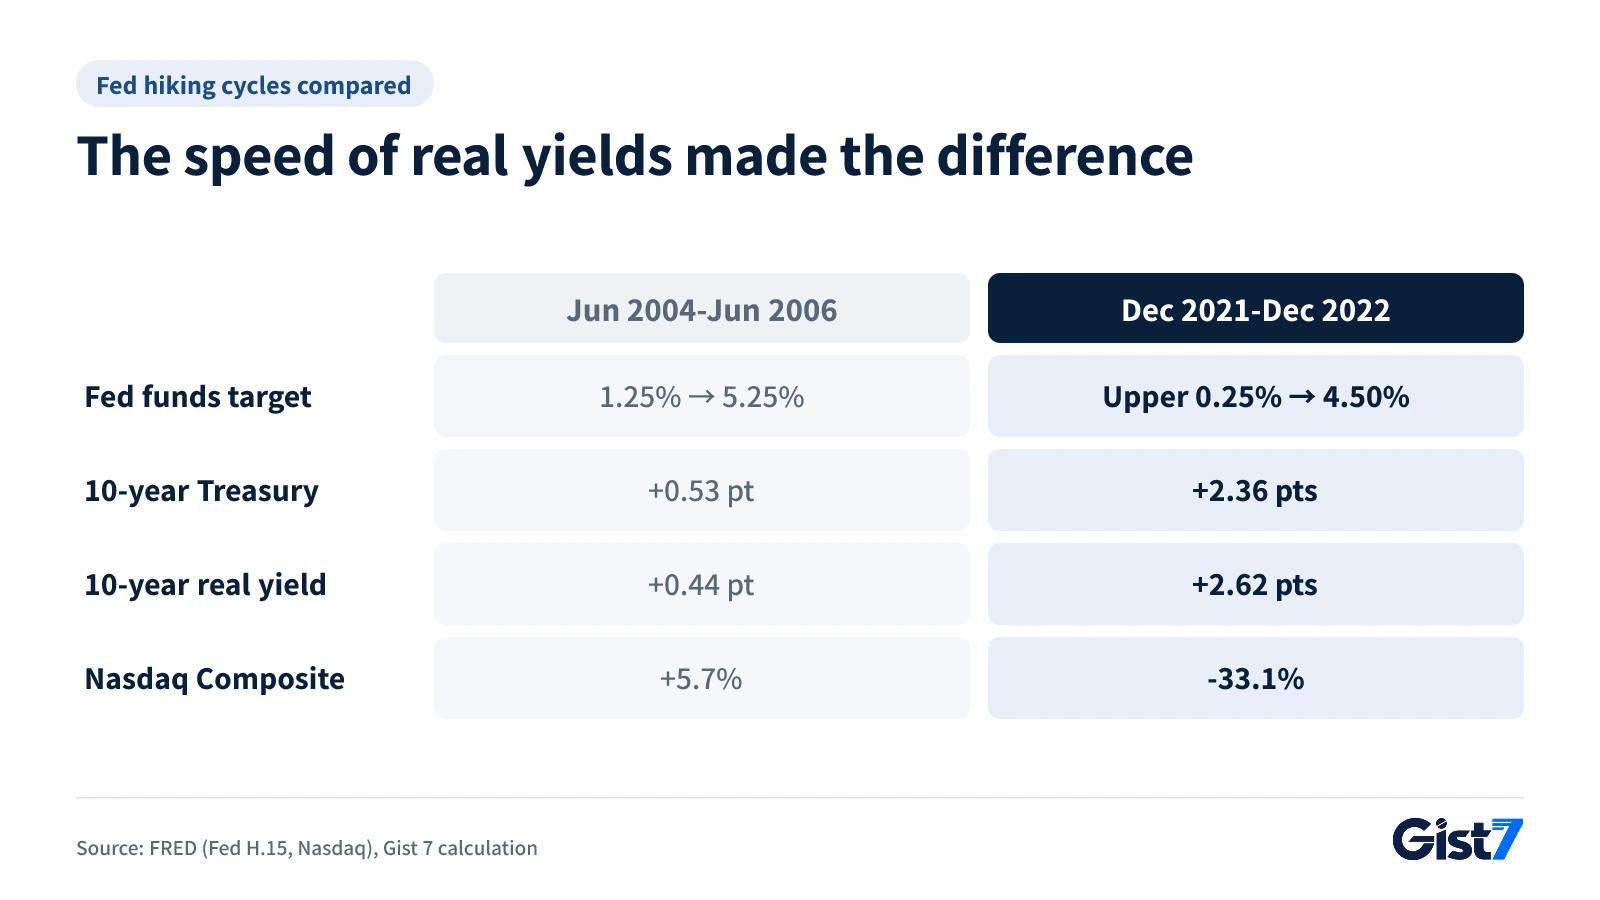
From 2004 to 2006, the policy rate rose 4 points, but the 10-year yield and the real yield rose only about half a point. The discount rate barely changed while an expanding economy lifted profits. In 2022, rapid hikes aimed at taming inflation drove the real yield up more than 2.6 points in a year, and the Nasdaq lost roughly a third of its value.
Which pattern does November 2026 look like?
In Gist 7's view, the rise in rates during the week of Nov. 9-13, 2026, looks more like 2022 than 2004. We use three tests: whether rates are rising because of growth or inflation, how quickly long-term and real yields are climbing, and whether earnings forecasts can keep pace.
According to the U.S. Treasury, the 10-year yield rose from 4.88% on Nov. 9 to 4.98% on Nov. 10, when the October consumer price index (CPI) came out, and to 5.15% on Nov. 13, when the producer price index (PPI) was released. Of that 0.27-point increase, 0.25 points came from higher real yields (2.66% to 2.91%). In other words, expectations of Fed tightening, not inflation expectations, pushed yields higher. The Nasdaq Composite (FRED, Nasdaq closing data) fell 0.74% and 0.91% on the two days the CPI and PPI were released (Nov. 10 and 13).
Rates alone do not set stock prices. For the full week, the Nasdaq rose about 2.3%, from 24,579.42 on Nov. 6 to 25,136.27 on Nov. 13. Rates are one force pushing stocks down, while earnings and growth expectations push the other way. We covered that week in October CPI and the 10-year yield nearing 5% and why the Nasdaq fell on Nov. 13. The indicators below will show whether this mix continues.
Market impact map
This table does not describe a single day's reaction. It shows how assets typically move when rates rise on expectations of tighter policy rather than stronger growth.
| Asset / indicator | Direction | Strength | Link (why) |
|---|---|---|---|
| 2-year Treasury yield | ↑ | Strong | The first place policy-rate expectations show up |
| 10-year Treasury yield | ↑ | Strong | The benchmark for equity discount rates, moves with real yields |
| Nasdaq | ↓ | Strong | Heavy weight of distant profits makes it the most rate-sensitive |
| S&P 500 | ↓ | Medium | Falls in line with its tech weighting, partly offset by financials and energy |
| KOSPI | ↓ | Medium | Higher U.S. rates can trigger foreign outflows and raise growth-stock discount rates |
| Dollar index | ↑ | Medium | Money flows to the U.S. in search of higher dollar yields |
| USD/KRW | ↑ | Medium | A stronger dollar and foreign stock selling weigh on the won |
| Gold | ↓ | Medium | Higher real yields raise the cost of holding a non-yielding asset |
| Bitcoin | ↓ | Medium | Sensitive to tighter liquidity and risk aversion |
| REITs, utilities | ↓ | Medium | Higher borrowing costs; dividends compete with bond yields |
Little direct impact: Oil (WTI) (supply and OPEC+ policy matter more)
- Loans: Rising U.S. market rates can put upward pressure on rates elsewhere, including South Korea, lifting payments on floating-rate loans. We covered the Bank of Korea's thinking in the outlook for a BOK rate hike.
- Travel and shopping abroad: A stronger dollar tends to raise the cost of overseas purchases and trips for people paid in other currencies.
Market reactions can vary with other factors, and this table is not a basis for investment decisions.
What to watch next
| Date (ET) | Indicator / event | Previous | Link to this article | If it comes in like this |
|---|---|---|---|---|
| Wed., Nov. 18, 2:00 p.m. | FOMC minutes (Oct. 27-28 meeting) | Held at 3.75%-4.00%, 10-2 vote (Fed) | How broad support for further hikes is | Broad support tends to lift 2- and 10-year yields and weigh on growth stocks |
| Wed., Nov. 25, 8:30 a.m. | October PCE inflation, Q3 GDP second estimate | September PCE inflation 3.6% y/y (BEA) | Whether rates are rising on inflation or growth | High inflation with weak growth looks more like 2022 |
| Fri., Dec. 4, 8:30 a.m. | November jobs report | October payrolls +165,000, unemployment 4.1% (BLS) | The economic strength behind earnings | Strong hiring lifts yields but also supports earnings expectations |
| Wed., Dec. 9, 2:00 p.m. | FOMC rate decision (Dec. 8-9) | 3.75%-4.00% (Fed) | The policy rate is the starting point for discount rates | A bigger hike tends to lift real yields and weigh on the Nasdaq and gold |
| Thu., Dec. 10, 8:30 a.m. | November CPI | October +0.4% m/m, core +0.3% (BLS) | Whether tightening lasts longer | Core at 0.3% or higher again tends to lift the 10-year yield |
Frequently asked questions
Do stocks always fall when interest rates rise?
No. When rates rise gradually because the economy is expanding, earnings growth can outweigh a higher discount rate. FRED data show the Nasdaq gained 5.7% from June 2004 to June 2006, while the Fed raised its target rate by 4 points.
Which stocks fall the most when rates go up?
Growth stocks whose profits lie far in the future, along with heavily indebted REITs and utilities, tend to swing the most. A higher discount rate cuts the present value of distant cash flows the most. Banks are mixed, because wider lending margins are offset by a higher risk of bad loans.
Do stocks rise when interest rates fall?
All else equal, a lower discount rate tends to help stock prices. A Fed paper by Bernanke and Kuttner found that a surprise 0.25-point cut between 1989 and 2002 was associated with roughly a 1% rise in stocks. But when rates are cut because of a recession, falling earnings can matter more.
Why do real yields matter for stocks?
The real yield is the nominal yield minus expected inflation, the true return on a safe asset after inflation. When it rises, the return investors demand from stocks rises too. In 2022, the U.S. 10-year real yield went from -1.04% to 1.58% and the Nasdaq fell 33.1% (FRED).
Do higher U.S. rates hurt Korean stocks (KOSPI)?
They tend to. Higher U.S. rates strengthen the dollar and make it easier for foreign money to move to the U.S., which can weaken the won and lead to foreign selling of Korean stocks. Strong earnings at Korean exporters such as chipmakers can offset some of that pressure.
References
- Monetary Policy: What Are Its Goals? How Does It Work? — Federal Reserve
- What Explains the Stock Market's Reaction to Federal Reserve Policy? (Bernanke·Kuttner, FEDS 2004) — Federal Reserve
- Daily Treasury Par Yield Curve Rates (November 2026) — U.S. Department of the Treasury
- Daily Treasury Par Real Yield Curve Rates (November 2026) — U.S. Department of the Treasury
- NASDAQ Composite Index (NASDAQCOM) — FRED, St. Louis Fed
- 10-Year Treasury Inflation-Indexed Security (DFII10) — FRED, St. Louis Fed
- 10-Year Treasury Constant Maturity (DGS10) — FRED, St. Louis Fed
- Stock market today: Dow rises, S&P 500 and Nasdaq slip to cap volatile week (2026-11-13) — Yahoo Finance