Bitcoin below $60,000: why it crashed with the Nasdaq
Key summary
Bitcoin below $60,000: it broke on November 20, 2026 (ET), the day the Nasdaq fell 5.28%, and hit $55,106 on November 21, 56.4% under its October 2025 peak. Its 20-day correlation with the Nasdaq was 0.74, and US spot ETFs lost about $3.47 billion through November 19.
- Bitcoin fell below $60,000 on November 20 (ET) for the first time since July and hit $55,106 early on November 21, its lowest since September 2024 (Coinbase).
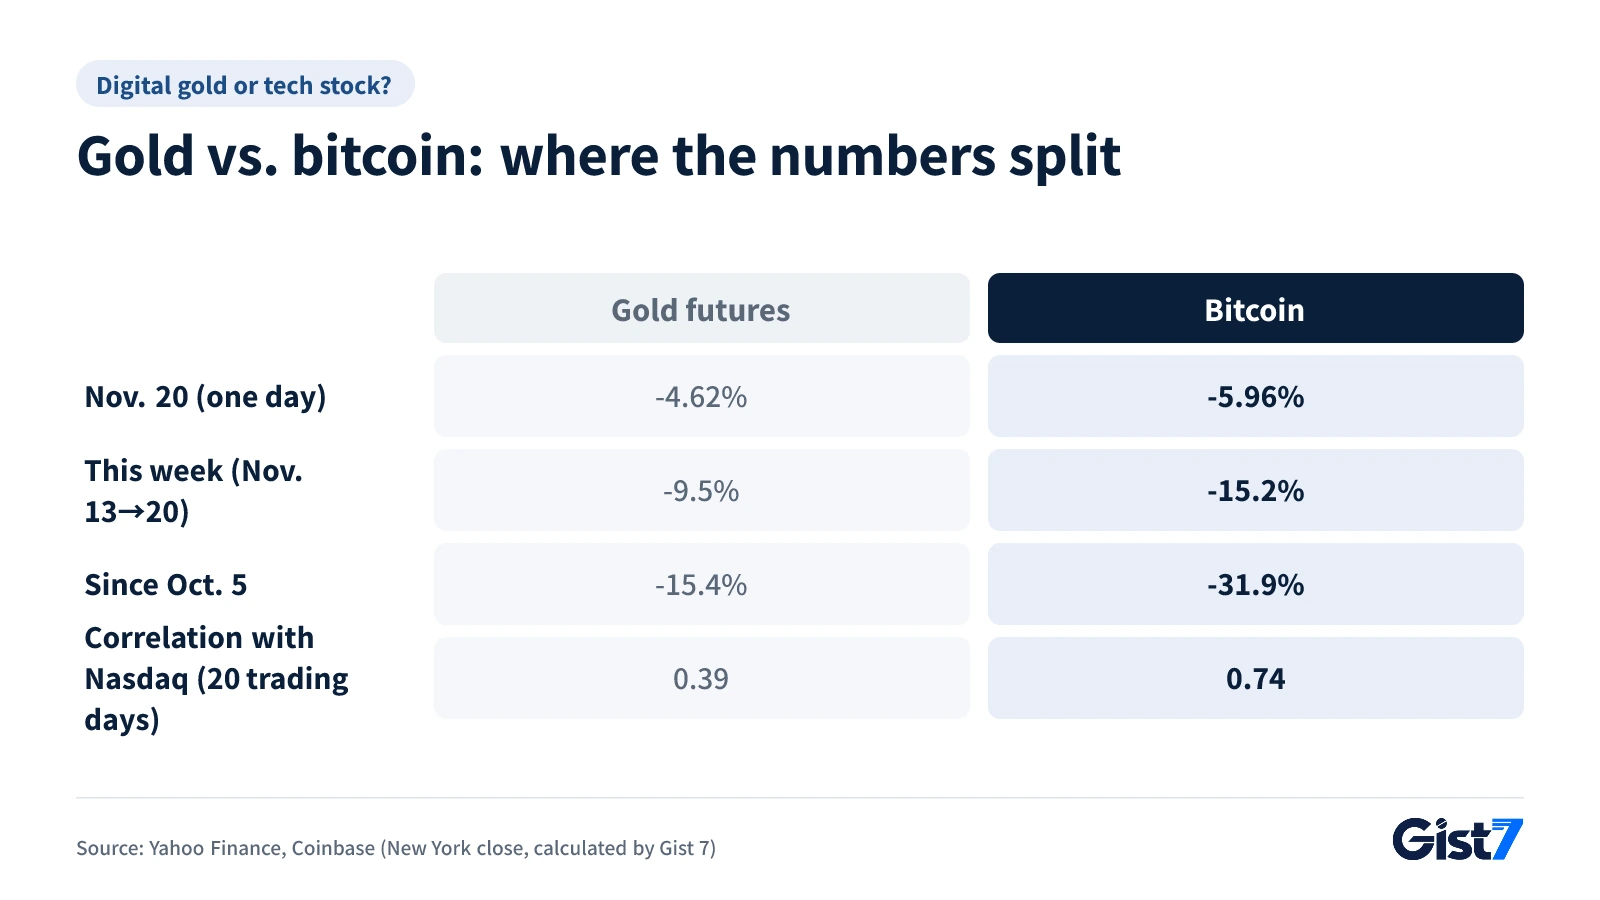
- Over the last 20 trading days, bitcoin's correlation with the Nasdaq was 0.74, versus 0.39 between gold and the Nasdaq, so bitcoin traded like a tech stock (Gist 7 calculation).
- Treasury yields fell on November 20 and the dollar barely moved, so this drop looks less like a rate shock and more like bitcoin being dragged down by selling in AI and chip stocks.
- US spot bitcoin ETFs saw net outflows of about $3.47 billion through November 19, and 93% of the November 19 outflow came from BlackRock's IBIT.
- On Korea's Upbit exchange, bitcoin hit a 52-week low of 76,433,000 won on November 21, and the kimchi premium of about 2.4% came mostly from a premium on Tether.
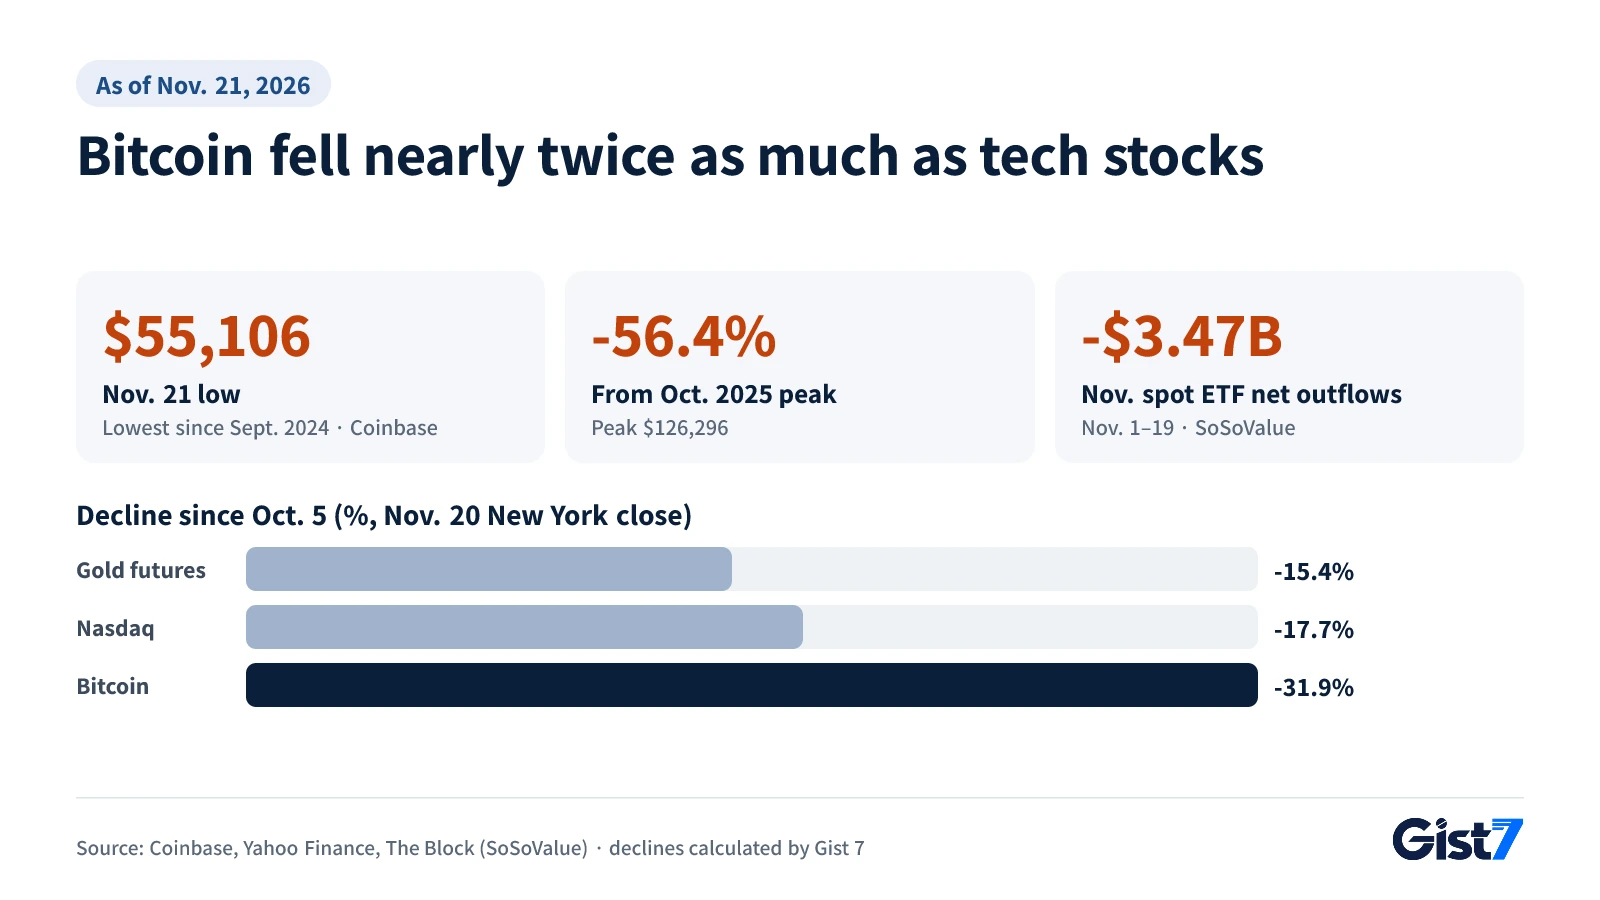
Bitcoin is back below $60,000. On the morning of Friday, November 20, 2026 (ET), bitcoin slipped under $60,000 for the first time since July. The Nasdaq Composite fell 5.28% the same day (Yahoo Finance). The selling carried on into the weekend, when US stock markets are closed, and bitcoin touched $55,106 at around 1:15 a.m. ET on Saturday, November 21 (3:15 p.m. in Seoul). Coinbase (Nasdaq: COIN) prices show that was the lowest level since September 2024 and 56.4% below the intraday record of $126,296 set on October 6, 2025 (decline calculated by Gist 7).
The break below $60,000 came at around 10:45 a.m. ET on Friday (12:45 a.m. Saturday in Seoul). The Philadelphia Semiconductor Index dropped 10.73% that day, and over the Friday session bitcoin fell by almost as much as the Nasdaq. It traded more like a tech stock than like "digital gold." By 2:21 a.m. ET on November 21 it was at $58,184, a little more than 5% above the low.
Bitcoin below $60,000: the two days, hour by hour
Bitcoin gave up $60,000 on Friday morning while US stocks were trading, then took another leg down early Saturday, after US markets had closed. All times are US Eastern Time (ET).
| Time (ET) | Price / event | Source |
|---|---|---|
| Nov. 20, morning | Slid into the $61,000s, lowest since July | Cryptoticker (CoinGecko) |
| Nov. 20, ~10:45 a.m. | Fell below $60,000 for the first time since July | Cryptoticker (CoinGecko) |
| Hour to 11:02 a.m., Nov. 20 | Crypto liquidations of $553 million, including $522.5 million in longs | Cryptoticker (CoinGlass) |
| Nov. 20, 4:00 p.m. | US stocks close, Nasdaq -5.28%. Bitcoin at $58,353 | Yahoo Finance, Coinbase |
| Nov. 20, 11:13 p.m. | $55,830, down 5.10% from a day earlier | Reuters (via Business Recorder) |
| Nov. 21, ~1:15 a.m. | Low of $55,106 | Coinbase 5-minute candles |
| Nov. 21, 2:21 a.m. | $58,184, down 5.9% over 24 hours | Coinbase |
Reuters reported that worries about high valuations weighed on AI-related stocks and other risk assets alike. Risk assets are investments whose prices swing widely with the economy and investor sentiment; stocks and crypto are the classic examples. Sentiment froze, too. The Crypto Fear & Greed Index from Alternative.me stood at 12 on November 21, in "extreme fear" territory, and had stayed between 10 and 13 for eight days starting November 14.
Why is bitcoin falling with the Nasdaq?
Bitcoin appears to be falling alongside the Nasdaq because a growing share of the money that trades bitcoin now comes from the same place as the money that trades tech stocks (a correlation only shows how closely two assets moved together; it does not prove cause). Over the last 20 trading days, the correlation of daily returns between bitcoin and the Nasdaq was 0.74, far higher than the 0.39 between gold and the Nasdaq (Gist 7 calculation). A correlation coefficient measures, on a scale from -1 to 1, how much two assets move in the same direction on the same day. The closer it is to 1, the more they rise and fall together.
| Correlation with bitcoin | Last 20 trading days (Oct. 26 to Nov. 20) | Prior 39 trading days (Aug. 28 to Oct. 22) |
|---|---|---|
| Nasdaq Composite | 0.74 | 0.66 |
| Gold futures | 0.56 | 0.47 |
| US dollar index | 0.04 | -0.21 |
Method: Gist 7 calculation from daily percentage changes on each US trading day in Coinbase bitcoin prices (4 p.m. ET) and Yahoo Finance closing prices. Gold is the front-month COMEX contract.
The 0.56 for gold futures in the table is the correlation between bitcoin and gold; the 0.39 in the paragraph above is between gold and the Nasdaq (over the same 20 trading days). In other words, bitcoin tracked the Nasdaq more closely than gold did, while gold and the Nasdaq moved only loosely together.
James Butterfill, head of research at crypto asset manager CoinShares (Nasdaq: CSHR), reached the same diagnosis. According to Cointelegraph, he saw selling in AI stocks, not a problem within crypto itself, as the main cause of the drop, and said bitcoin increasingly trades like a liquidity-sensitive growth asset. Since spot ETFs arrived in 2024, bitcoin has sat in the same brokerage accounts and the same asset allocation models as shares of Nvidia (Nasdaq: NVDA). When the signal comes to cut risk, it is easy to trim both at once.
Gold offered no shelter either. On November 20, December gold futures fell 4.62% and bitcoin 5.96% (New York close, Yahoo Finance and Coinbase). Gold falling on a day when yields dropped suggests investors may have sold whatever they could to raise cash and cover losses. That is Gist 7's interpretation. Over a longer stretch, though, the gap widens: since October 5, gold is down 15.4%, the Nasdaq 17.7% and bitcoin 31.9%.
Rates and the dollar did not lead this decline. According to the US Treasury, the 10-year yield fell from 5.04% to 4.92% on November 20 and the 2-year yield from 4.76% to 4.63%. That is normally a helpful shift for assets that pay no interest. The US dollar index was nearly flat, moving from 103.90 to 103.81 (Yahoo Finance), and its 20-day correlation with bitcoin was 0.04, effectively zero. The tight-money backdrop has not gone away, however. The Federal Reserve held its policy rate at 3.75% to 4.00% at its October meeting, but two officials dissented in favor of a 0.25-percentage-point hike (Fed statement). Cointelegraph reported that the prediction market Polymarket priced a 94% chance of a further hike at the December 9 decision (as of 5:19 p.m. UTC on November 20). Butterfill also said high rates made this selloff harsher. There is not much spare money in the market to fund a rebound. How US stocks broke down that day is covered in the Nvidia probe reports and the Nasdaq's 5% plunge.
Bitcoin ETF outflows through November 19: $3.47 billion
The buying that might have supported bitcoin has also thinned out. US spot bitcoin ETFs posted net outflows of about $3.47 billion from November 1 through November 19 (SoSoValue data via The Block). Only two days in that period, November 4 and November 16, saw net inflows, and together they came to $82.5 million. By week, outflows were $1.28 billion for November 2 to 6 and $1.07 billion for November 9 to 13; subtracting those two weeks from the month-to-date total leaves roughly $1.12 billion for November 16 to 19 (The Block, Gist 7 calculation).
The money left mostly through the biggest fund. Of the $582.2 million in net outflows on November 19, 93% came from the iShares Bitcoin Trust (Nasdaq: IBIT) run by BlackRock (NYSE: BLK), while Morgan Stanley's (NYSE: MS) MSBT actually took in $49.6 million (The Block). As of November 19, total net assets of US spot bitcoin ETFs were $76.6 billion, or 6.1% of bitcoin's market capitalization. IBIT alone had net assets of $53.99 billion as of November 14, less than its cumulative net inflows of $64.19 billion since launch (The Block). Gist 7's reading is that, with holdings worth less than the money put in, investors are under water on average, and redemptions to limit losses could feed a loop that pushes prices down again. Flow data for Friday, November 20 was not yet available as of 2 a.m. ET on November 21, when this article was written. The earlier stage of the ETF exodus is covered in our piece on five straight weekly losses and ETF flows.
Forced liquidations amplified the drop. According to Cryptoticker, citing data from CoinGlass (private), $1.33 billion of crypto futures positions were forcibly closed in the 24 hours to about 4 p.m. UTC on November 20, roughly 90% of them longs betting on higher prices. A total of 250,931 traders were liquidated. How liquidations feed a decline is explained in our November 14 analysis of the liquidation cascade.
Will bitcoin fall further? What to check before price levels
No one can know in advance whether bitcoin will fall further. But because this decline was largely dragged along by selling in stocks, signs of a bottom are also more likely to show up first in the Nasdaq and in ETF flows than on the price chart. The levels often cited in the market, listed below, are simply places where the price paused in the past; they do not guarantee support.
| Level | What happened there (Coinbase) |
|---|---|
| $60,000 | The line broken on Nov. 20; the bottom of the $60,000 to $90,000 range Butterfill cited |
| $57,717 | Intraday low on July 1, 2026; the year's low until Nov. 20 |
| $55,106 | Low on Nov. 21; lowest since September 2024 |
| $52,530 | Intraday low on Sept. 6, 2024 |
| $49,050 | Intraday low on Aug. 5, 2024 |
Views differ. Butterfill said the brief dip below the range was uncomfortable but did not change his view, and that short-term losses could grow if the AI selloff deepens, while bitcoin could also recover quickly once tech stocks stabilize. Alexander Blume, CEO of Two Prime (private), said the selling and the leverage liquidations were mostly over (Cointelegraph). Gist 7 sees three forks in the road.
- Do the Nasdaq and chip stocks stop falling? As long as the 0.74 correlation holds, news about the investigations surrounding Nvidia can pass straight through to bitcoin.
- Do ETF outflows shrink? The first sign of a shift in supply and demand is whether daily outflows of hundreds of millions of dollars stop and net inflows last for several days.
- The Fed's December decision: A hike is already priced in, so if signals of further hikes after the move are weak, pressure on risk assets broadly could ease.
What it means for global and Korean investors: weekend spot trading and a 2.4% kimchi premium
For investors who trade in dollars, a dollar price such as Coinbase's is the profit or loss. This weekend there is one more structural point to keep in mind. US spot ETFs are closed on weekends along with the stock market, while bitcoin on spot exchanges trades around the clock. The November 21 low of $55,106 also came on a Saturday, when ETFs were not trading. ETF investors cannot trade on this move until US markets open at 9:30 a.m. ET on Monday, November 23, and until then thin spot trading sets the price, so even small sales can cause large swings.
Products in Asia moved differently from those in the US. Hong Kong spot bitcoin ETFs took in about $5.9 million in net inflows so far in November (CoinGlass data via The Block). That is tiny next to the US outflows and not large enough to hold up the price.
For investors in South Korea, where crypto trades mainly on local exchanges priced in won, the exchange rate and the kimchi premium sit on top of the dollar price. Korean exchange prices also set new 52-week lows. On Upbit (operated by Dunamu, private), bitcoin fell to 76,433,000 won on November 21, a 52-week low, and traded at 80,200,000 won at 4:21 p.m. Korea time (2:21 a.m. ET). That is 43.9% below the 52-week high of 143,050,000 won on January 14. The drop is larger than the decline in the dollar price over the same period (40.6% from the January 14 intraday high, Coinbase) because the won strengthened against the dollar in the meantime.
The kimchi premium is the percentage by which bitcoin on Korean exchanges trades above the overseas dollar price converted into won. Multiplying Coinbase's $58,184 at 4:21 p.m. Korea time by the last New York quote on November 20 of 1,346.13 won per dollar (Yahoo Finance) gives about 78.32 million won, so Upbit's price was about 2.4% higher (Gist 7 calculation). Most of that premium is a premium on the dollar itself: at the same moment, the dollar-pegged stablecoin Tether (USDT) traded at 1,376 won on Upbit, 2.2% above the exchange rate.
Market impact map
| Asset / indicator | Direction | Strength | Link (why) |
|---|---|---|---|
| Bitcoin | ↓ | Strong | Sold in step with AI and chip stocks, with ETF outflows on top. -5.9% over 24 hours, $58,184 (Nov. 21, 2:21 a.m. ET, Coinbase) |
| Nasdaq | ↓ | Strong | Starting point of this decline. -5.28% on Nov. 20 on worries about high valuations of AI-related stocks (Yahoo Finance) |
| S&P 500 | ↓ | Medium | The same risk-off selling spread across large caps. -3.69% on Nov. 20, smaller than the Nasdaq (Yahoo Finance) |
| Ether | ↓ | Strong | Same risk-off selling as bitcoin. -6.4% over 24 hours, about $1,633 (Nov. 21, 2:22 a.m. ET, Coinbase) |
| Gold | ↓ | Medium | Apparently sold alongside in a scramble for cash. December futures -4.62% on Nov. 20 at $3,515.4 (Yahoo Finance) |
| 10-year Treasury | ↓ (yield down) | Medium | Bitcoin fell even as yields dropped, showing this was not a rate shock. 5.04%→4.92% (Nov. 20, US Treasury) |
| 2-year Treasury | ↓ (yield down) | Weak | Down 13 bp on the day, but the December hike outlook is unchanged, so it did not ease pressure on risk assets. 4.76%→4.63% (Nov. 20, US Treasury) |
| Spot bitcoin ETF flows | ↓ outflow | Strong | About -$3.47 billion through Nov. 19 (SoSoValue, The Block) |
Little direct impact: US dollar index, won/dollar exchange rate, crude oil (WTI), KOSPI (South Korea's benchmark stock index)
- Crypto investors in Korea: the won price is set by the dollar price, the won/dollar exchange rate and the kimchi premium together. On the afternoon of Nov. 21 (Korea time) the premium was about 2.4%, mostly from the premium on Tether.
Market reactions can vary with other factors, and this table is not a basis for investment decisions.
What to watch next
| Date (ET) | Indicator / event | Previous | Why it matters here | If it comes in like this |
|---|---|---|---|---|
| Evening of each US trading day from Nov. 23 (Mon) | US spot bitcoin ETF net flows (that day's US session) | Nov. 19: -$582.2 million (SoSoValue, The Block) | Whether money shared with stocks comes back | Several days of inflows could support a rebound; continued outflows tend to keep up the pressure |
| Nov. 25 (Wed) 8:30 a.m. | US October PCE prices and second estimate of Q3 GDP | September PCE +3.6% year over year (BEA) | Size of the December hike and next year's path | A hot reading tends to add rate pressure and weigh on risk assets |
| Nov. 26 (Thu) to Nov. 27 (Fri) | US Thanksgiving market holiday (Nov. 26) and early close (1 p.m. ET, Nov. 27) | None (NYSE holiday schedule) | ETF trading stops or is shortened | Thin trading can make the same selling move prices more |
| Dec. 4 (Fri) 8:30 a.m. | US November jobs report | October nonfarm payrolls +165,000, unemployment rate 4.1% (BLS) | Data that could change the hike path | A cooling job market could raise hopes for slower hikes and give risk assets room |
| Dec. 9 (Wed) 2:00 p.m. | FOMC rate decision and economic projections (Dec. 8 to 9 meeting) | 3.75% to 4.00% (held on Oct. 28, Fed) | A hike is largely priced in | Weak signals of further hikes tend to ease pressure on stocks and bitcoin |
Frequently asked questions
Why did bitcoin fall below $60,000?
The biggest reason was the plunge in US AI and semiconductor stocks on the same day. On November 20 the Nasdaq fell 5.28% and the Philadelphia Semiconductor Index 10.73%, and Reuters reported that worries about high valuations weighed on AI stocks and other risk assets together. November outflows from US spot ETFs and liquidations of leveraged long positions deepened the drop.
Bitcoin is called digital gold, so why is it falling with stocks?
Right now the money that trades bitcoin overlaps with the money that trades tech stocks. By Gist 7's calculation, bitcoin's correlation with the Nasdaq over the last 20 trading days was 0.74, higher than that between gold and the Nasdaq (0.39). Since spot ETFs put bitcoin into the same accounts as stocks, the two are more often sold together when investors cut risk.
How much money left bitcoin spot ETFs through November 19?
According to The Block, citing SoSoValue data, US spot bitcoin ETFs had net outflows of about $3.47 billion from November 1 to November 19. Only two days, November 4 and November 16, saw net inflows, and $582.2 million left on November 19 alone.
How far is bitcoin below its peak?
On Coinbase, the intraday record was $126,296 on October 6, 2025. The November 21, 2026 low of $55,106 is 56.4% below that, and the price of $58,184 at 2:21 a.m. ET (4:21 p.m. in Seoul) the same day is 53.9% below it.
What is the kimchi premium right now?
About 2.4% as of 4:21 p.m. Korea time on November 21 (2:21 a.m. ET). Gist 7 compared Upbit's price of 80,200,000 won with Coinbase's $58,184 multiplied by 1,346.13 won per dollar (about 78.32 million won). Most of the premium came from Tether trading 2.2% above the exchange rate.
What should I watch to judge whether bitcoin falls further?
It is more useful to watch the variables behind the drop than to guess at prices. The key questions are whether the Nasdaq and chip stocks stabilize, whether US spot ETFs return to net inflows, and whether the Fed's decision on December 9 (2 p.m. ET) signals further hikes. This article is not investment advice, and any decision should match your own tolerance for risk.
References
- Bitcoin falls 5.10% to $55,830 (Reuters story republished) — Business Recorder (2026-11-21)
- Bitcoin falls below $60K for first time since July amid broader market selloff — Cointelegraph (2026-11-20)
- Bitcoin falls below $60,000 for the first time since July — Cryptoticker (2026-11-20, citing CoinGecko and CoinGlass)
- US spot bitcoin ETFs see $582 million in daily net outflows as November total nears $3.5 billion — The Block (2026-11-20, SoSoValue data)
- Bitcoin ETFs lose $1 billion for the second week in a row — The Block (2026-11-14, SoSoValue data)
- BTC-USD hourly, 5-minute and daily candles (Exchange API) — Coinbase
- KRW-BTC and KRW-USDT tickers (Quotation API) — Upbit
- Nasdaq Composite historical data — Yahoo Finance (also used for gold futures GC=F, US dollar index DX-Y.NYB and won/dollar KRW=X)
- Daily Treasury Par Yield Curve Rates (November 2026) — US Treasury
- Crypto Fear & Greed Index — Alternative.me
- Federal Reserve issues FOMC statement (2026-10-28) — Federal Reserve
- Meeting calendars and information — Federal Reserve
- Release Schedule — US Bureau of Economic Analysis (BEA)
- The Employment Situation, October 2026 — US Bureau of Labor Statistics (BLS)
- Holidays and Trading Hours — New York Stock Exchange (NYSE)