Taiwan vs Korea GDP per capita: why Korea fell behind
Key summary
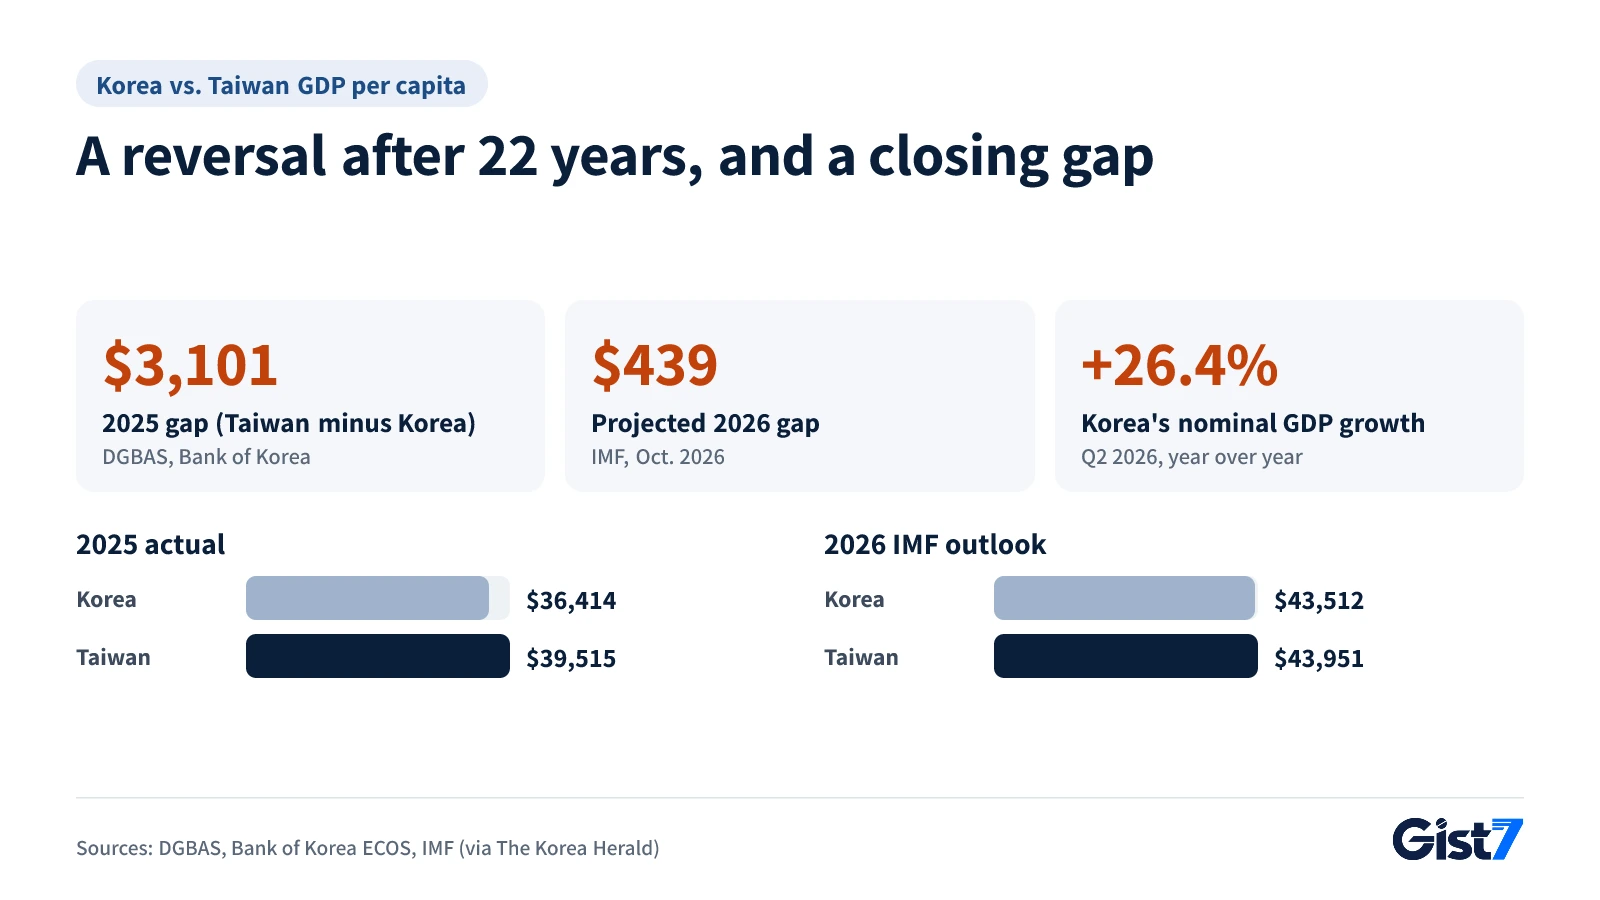
Taiwan vs. Korea GDP per capita flipped in 2025 for the first time in 22 years: Taiwan $39,515, Korea $36,414. Real growth (8.76% vs. 1.1%) mattered more than the weak won. In 2026, memory prices are set to lift Korea's nominal GDP over 20%, and the IMF sees the gap shrinking to $439.
- 2025 GDP per capita: Taiwan $39,515, Korea $36,414, the first reversal in 22 years, a $3,101 gap
- Main cause was real growth (Taiwan 8.76% vs. Korea 1.1%); currency widened the gap (at 2024 exchange rates Taiwan still leads by about $340, Gist 7 calculation)
- Taiwan's volume boom in foundries and AI servers came first; Korea's memory gains arrived with the 2026 price surge
- Korea's nominal GDP up 17.1% in Q1 and 26.4% in Q2 2026; IMF October gap $439; Seoul calls $40,000-plus GNI per capita certain
- Variables: memory prices, the annual average won-dollar rate, Taiwan's November forecast revision
Taiwan's gross domestic product (GDP) per capita reached $39,515 in 2025, while South Korea's came in at $36,414. Put the figures from Taiwan's Directorate-General of Budget, Accounting and Statistics (DGBAS) next to the Bank of Korea's, and Taiwan vs. Korea GDP per capita has flipped for the first time in 22 years, as The Korea Herald reported. GDP per capita is the value added produced inside a country in a year divided by its population, converted into U.S. dollars when countries are compared. Both economies sit in the middle of a chip boom. What separated them was the order in which that boom arrived.
Taiwan vs. Korea GDP per capita: has Korea really fallen behind?
On 2025 numbers, yes. Taiwan led by $3,101, or about 8.5%, a year after Korea had been $2,089 ahead in 2024.
| Year | South Korea | Taiwan | Gap (Taiwan minus Korea) |
|---|---|---|---|
| 2022 | $34,875 | $32,827 | −$2,048 |
| 2023 | $35,665 | $32,444 | −$3,221 |
| 2024 | $36,327 | $34,238 | −$2,089 |
| 2025 | $36,414 | $39,515 | +$3,101 |
Sources: Bank of Korea ECOS (GDP per capita in dollars); DGBAS release of May 29, 2026 (2025 figure revised).
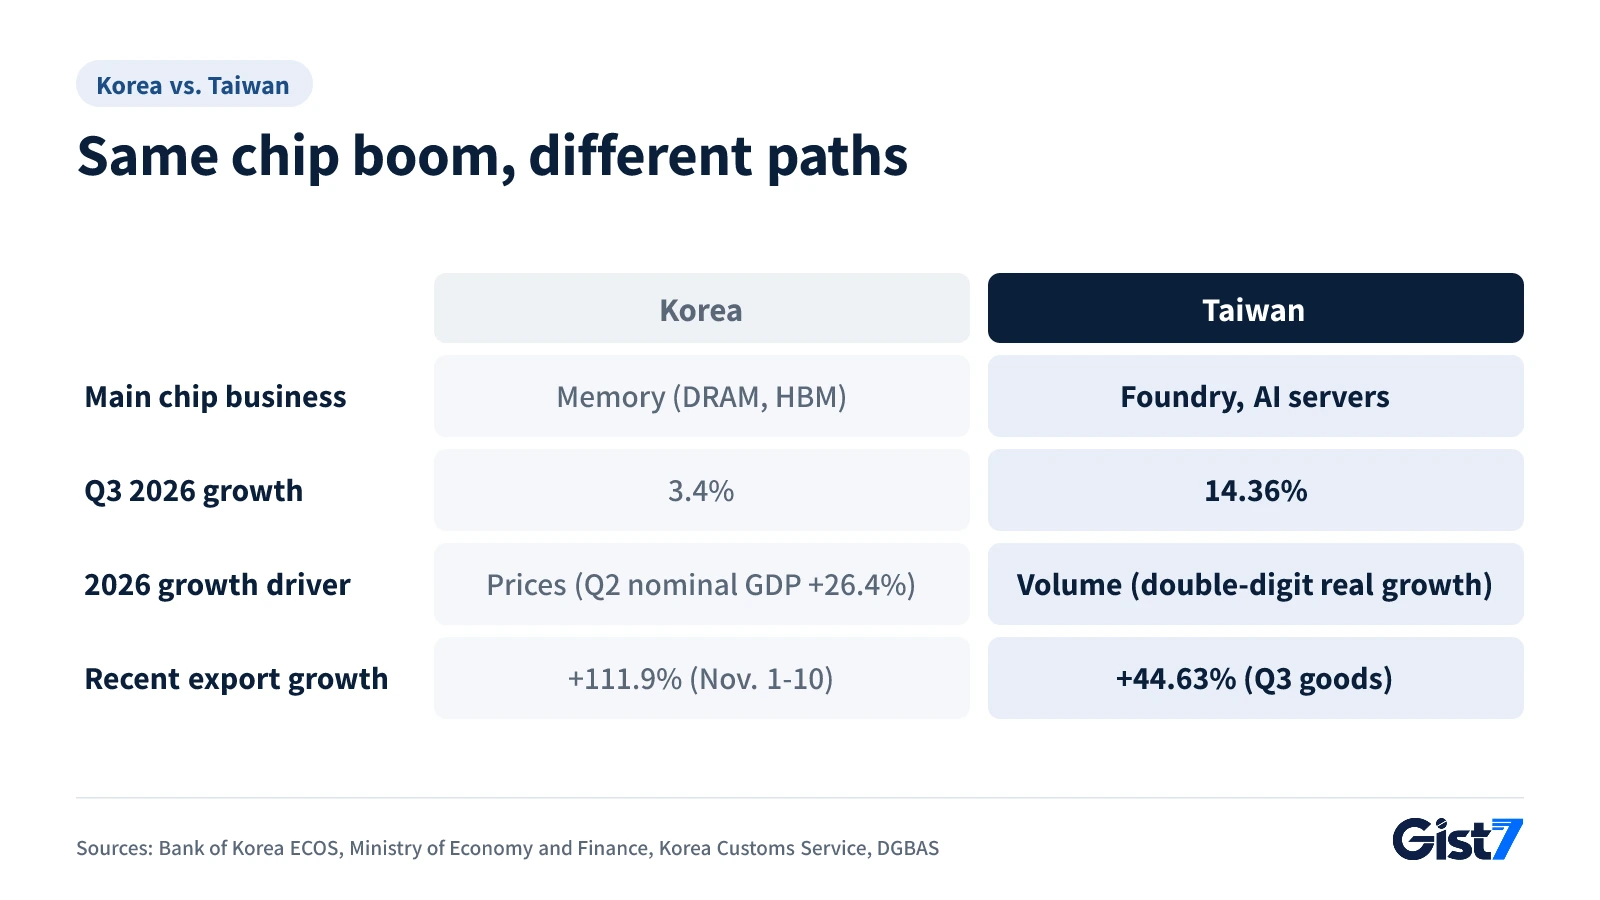
Taiwanese media have used the phrase "Korea's economic decline," but the data tell a different story. According to Korea's Ministry of Economy and Finance (Oct. 27), real GDP grew 3.4% year over year in the third quarter of 2026, and the government expects growth in the mid-3% range for the full year. Taiwan simply grew much faster, at 14.36% in the same quarter (DGBAS advance estimate). For a cost-of-living angle, see our Korea vs. Japan price comparison.
Why Taiwan overtook Korea: growth mattered more than the currency
A weaker won played a part, but the bigger driver was real growth: 1.1% in Korea versus 8.76% in Taiwan in 2025, a gap of nearly eightfold. The average won-dollar rate rose from 1,363.98 won in 2024 to 1,422.22 won in 2025, according to the Bank of Korea, a 4.1% drop in the won's value. As a result, per capita GDP of 51.789 million won translated into only 0.2% growth in dollar terms.
Freeze exchange rates at 2024 averages and the ranking still holds: about $37,970 for Korea and about $38,307 for Taiwan, a Taiwanese lead of roughly $340. Over the same period the NT dollar gained about 3.2% against the U.S. dollar. Taiwan's 2024 rate (about NT$32.11 per dollar) is backed out of DGBAS per capita GDP in New Taiwan dollars and U.S. dollars (Gist 7 calculation). Growth changed the order. The currency widened the gap to $3,101.
Foundries and AI servers came first, memory came later
Taiwan's AI boom showed up first as volume. TSMC (TWSE: 2330 · NYSE ADR: TSM), which manufactures AI chips under contract, and AI server makers Foxconn (Hon Hai · TWSE: 2317) and Quanta Computer (TWSE: 2382) turned U.S. Big Tech data center spending into orders. DGBAS data show Taiwan's 2025 merchandise exports (customs basis) rose 34.75% to $640 billion.
Korea's mainstay, memory chips, is a cyclical business where prices swing. Earnings at Samsung Electronics (KOSPI: 005930) and SK hynix (KOSPI: 000660) depend heavily on prices for DRAM and high-bandwidth memory (HBM), a fast memory made by stacking DRAM layers and placing them next to AI processors. Those prices began to show up in Korea's GDP in a big way only in 2026.
2026: memory prices lift Korea's nominal GDP
The gap is closing fast in 2026. According to the Bank of Korea, Korea's nominal GDP rose 17.1% year over year in the first quarter and 26.4% in the second. Set against real growth of 3.4% in the third quarter, that means most of the increase came from prices, above all chip export prices. The Korea Customs Service reported exports of $33.5 billion for Nov. 1 to 10, up 111.9% from a year earlier, with semiconductors up 331.2% to $16.6 billion, or 49.7% of the total. The periods differ, but Korea's pace is faster than Taiwan's third-quarter merchandise export growth of 44.63% in U.S. dollar terms (DGBAS).
| 2026 GDP per capita outlook | South Korea | Taiwan | Gap |
|---|---|---|---|
| 2025 actual (reference) | $36,414 | $39,515 | $3,101 |
| IMF World Economic Outlook (Oct. 2026) | $43,512 | $43,951 | $439 |
| DGBAS (Aug. 2026) | n/a | $45,332 | n/a |
Sources: The Korea Herald (IMF October WEO), Taiwan's Public Television Service, PTS (DGBAS release of Aug. 14).
In April, the IMF expected Korea to cross $40,000 in 2028. Its October outlook pulled that forward two years, to 2026. The same outlook has Korea moving back ahead of Taiwan in 2027 at about $49,277, with Taiwan retaking the lead in 2030 (The Korea Herald).
Seoul's forecast uses a different yardstick. The Ministry of Economy and Finance expects nominal GDP to grow more than 20% this year and called Korea's entry into the $40,000 range for gross national income (GNI) per capita "certain." GNI adds to GDP the difference between income earned abroad and income paid to foreigners. The government's call is about GNI. The IMF figure is GDP.
When will Korea pass $40,000, and can it overtake Taiwan again?
If the IMF is right, Korea's GDP per capita tops $40,000 in 2026, and the government considers $40,000-plus GNI per capita a given. Official confirmation will come with the Bank of Korea's preliminary annual national accounts, released each year in early March. The IMF points to 2027 for Korea to pull ahead of Taiwan again, but that depends on three things.
First, memory prices. This rebound is driven by price rather than volume, so if prices turn, nominal GDP can shrink quickly.
Second, the exchange rate. GDP per capita is converted at the annual average rate, so a few months of won strength feed through slowly, while a weaker won erodes gains. In 2022, when the won weakened, Korea's GDP per capita fell 7.1%, from $37,534 in 2021 to $34,875. We covered recent won moves in our weekly won-dollar analysis.
Third, Taiwan keeps rising too. Third-quarter growth of 14.36% beat the August forecast (11.42%) by 2.94 percentage points, so Taiwan's per capita GDP estimate could be raised again in the November revision. In August, DGBAS put Taiwan's 2027 GDP per capita at $49,874 (PTS).
Gist 7 sees the per capita ranking as something close to a report card graded by chip prices and exchange rates. Korea's 2026 rebound produces numbers that catch up with Taiwan, but they are far from what households feel. While chips drive growth, Korea's youth employment rate has fallen for 30 straight months. Comparing the two economies on GDP per capita alone misses real growth and household income.
Market impact map
| Asset or indicator | Direction | Strength | Why |
|---|---|---|---|
| Memory chip stocks (Samsung Electronics, SK hynix) | ↑↓ | Strong | Up if memory prices keep rising, down if they turn. Memory prices are the core of Korea's nominal GDP rebound, so earnings and the pace toward $40,000 move together |
| USD/KRW | ↓ tendency | Medium | Strong chip exports bring in dollars, which tends to push the rate down (stronger won). A lower rate raises dollar-based GDP per capita for the same won income |
| KOSPI | ↑↓ | Medium | Up if the memory upturn continues, down if it fades. The heavy chip weighting makes the index sensitive to the memory cycle |
| Taiwan's TAIEX and TSMC | ↑↓ | Medium | Up if U.S. Big Tech data center spending grows, down if it shrinks. Taiwan's growth rests on AI server and foundry volumes |
| New Taiwan dollar | ↑ tendency (if exports stay strong) | Weak | A stronger NT dollar raises Taiwan's GDP per capita in dollar terms |
Little direct impact: 2-year Treasury yield, 10-year Treasury yield, dollar index, gold, oil (WTI), bitcoin, S&P 500, Nasdaq
- Everyday impact: $40,000 in GDP or GNI per capita is an average, not household income. Korea's household gross disposable income per capita was $20,514.8 in 2025 (Bank of Korea).
- If the won keeps strengthening, spending abroad, such as on a trip to Taiwan, costs Koreans less in won.
Market reactions can vary with other factors, and this table is not a basis for investment decisions.
What to watch next
| Date (Korea time) | Indicator or event | Previous | Why it matters here | If it comes in like this |
|---|---|---|---|---|
| Late November (expected) | DGBAS Q3 GDP preliminary estimate and revised 2026 and 2027 outlook | August outlook: 2026 growth 11.05%, GDP per capita $45,332 (PTS) | Taiwan's per capita GDP projection | Higher growth and a stronger NT dollar would lift Taiwan's estimate, tending to slow the narrowing of the gap |
| Dec. 1 (Tue., expected) | Korea November trade data (Ministry of Trade, Industry and Resources) | Nov. 1-10 exports $33.5 billion, chips $16.6 billion (Korea Customs Service) | Whether memory prices and volumes keep lifting nominal GDP | Sustained chip growth strengthens the $40,000 outlook. A slowdown raises concern the rebound will shrink |
| Dec. 9 (Wed.) 08:00 KST (Dec. 8, 6 p.m. ET) | Bank of Korea Q3 national accounts (preliminary) | Q2 nominal GDP +26.4% year over year (Bank of Korea) | How fast GDP and GNI per capita reach $40,000 | Nominal growth staying above 20% makes a $40,000 annual figure more likely |
Dates follow the Bank of Korea's SDDS release calendar, DGBAS release practice (February, May, August and November) and the trade ministry's practice of publishing on the first of each month, and may change.
Frequently asked questions
When did Taiwan's GDP per capita overtake South Korea's?
In 2025. Taiwan reached $39,515 on DGBAS revised data and Korea $36,414 on Bank of Korea data, a Taiwanese lead of $3,101. Korea had been ahead through 2024, and the reversal was the first in 22 years.
Why did Korea fall behind Taiwan in GDP per capita?
Mostly because of the 2025 gap in real growth. Taiwan grew 8.76% on AI server and foundry exports, while Korea grew 1.1%. A weaker won (annual average from 1,363.98 to 1,422.22 per dollar) widened the gap, but even at 2024 exchange rates for both, Taiwan leads by about $340 (Gist 7 calculation).
When will Korea's GDP per capita reach $40,000?
The IMF's October 2026 outlook puts Korea's GDP per capita at $43,512, implying it crosses $40,000 in 2026. Korea's Ministry of Economy and Finance called the $40,000 range certain on a GNI per capita basis, not GDP. Official figures come with the Bank of Korea's preliminary annual data in early March 2027.
Is South Korea's economy in decline?
Not by growth figures. Korea's real GDP rose 3.4% year over year in Q3 2026, and the government expects mid-3% growth for the year. It only looks slow next to Taiwan's 14.36% in the same quarter.
Why do the IMF and Taiwan's government give different numbers?
They were released at different times with different exchange rate and growth assumptions. For Taiwan's 2026 GDP per capita, the IMF projected $43,951 in October and DGBAS $45,332 in August. Dollar figures are sensitive to exchange rates, so estimates for the same year can differ by thousands of dollars.
References
- National income statistics and economic outlook (May 29, 2026; GDP per capita and export tables) — DGBAS, Taiwan
- Advance estimate of Q3 2026 national income — DGBAS, Taiwan (Oct. 30, 2026)
- DGBAS raises 2026 growth forecast to 11.05%, GDP per capita $45,332 (Aug. 14, 2026) — PTS News
- GDP per capita in U.S. dollars, 2016-2025 — Bank of Korea ECOS
- Key annual indicators 2025: GDP per capita (won), real growth, household disposable income per capita — Bank of Korea ECOS
- Nominal GDP, year-over-year change by quarter, 2025-2026 — Bank of Korea ECOS
- Won-dollar base rate, annual averages 2023-2025 — Bank of Korea ECOS
- IMF October 2026 WEO: Korea's GDP per capita to top $40,000 this year (Oct. 14, 2026) — The Korea Herald
- Q3 growth 1.0%, mid-3% growth likely this year (Oct. 27, 2026) — Korea.kr, Ministry of Economy and Finance
- Exports and imports, Nov. 1-10, 2026 (preliminary) — Korea Customs Service via Korea.kr