US CPI Release Nov. 10: Economic Calendar for the Week Ahead

Key summary
The US CPI release for October is due Tuesday, Nov. 10, 2026, at 8:30 a.m. ET. Markets will judge whether headline (3.7% in September) and core inflation (2.6%) cool, shaping December Fed hike odds. China prices, UK GDP and US PPI follow the same week.
- October CPI is released Tuesday, Nov. 10, at 8:30 a.m. ET by the Bureau of Labor Statistics (10:30 p.m. in Seoul and Tokyo)
- September CPI rose 3.7% from a year earlier, core 2.6%; the Cleveland Fed nowcast puts October at 3.74% and core at 2.48%
- October PPI comes Friday, Nov. 13, not Nov. 11; the BLS publishes nothing on Veterans Day
- CME FedWatch put December hike odds at 76.8% on Nov. 6, so 2-year yields and the dollar are likely to react first
- China's October CPI and PPI come out Nov. 9 (Beijing time), UK Q3 GDP on Nov. 12; US retail sales slip to Nov. 17
The next US CPI release is set: the Bureau of Labor Statistics (BLS) will publish the October Consumer Price Index (CPI) on Tuesday, Nov. 10, 2026, at 8:30 a.m. Eastern Time, according to its release calendar. Daylight saving time ended on Nov. 1, so the gap with Seoul and Tokyo is now 14 hours and the number hits Asian screens at 10:30 p.m. local time. Two figures matter most. Headline inflation ran at 3.7% year over year in September and core inflation at 2.6%. Whether either one cools will shape the case for a December rate hike by the Federal Reserve.
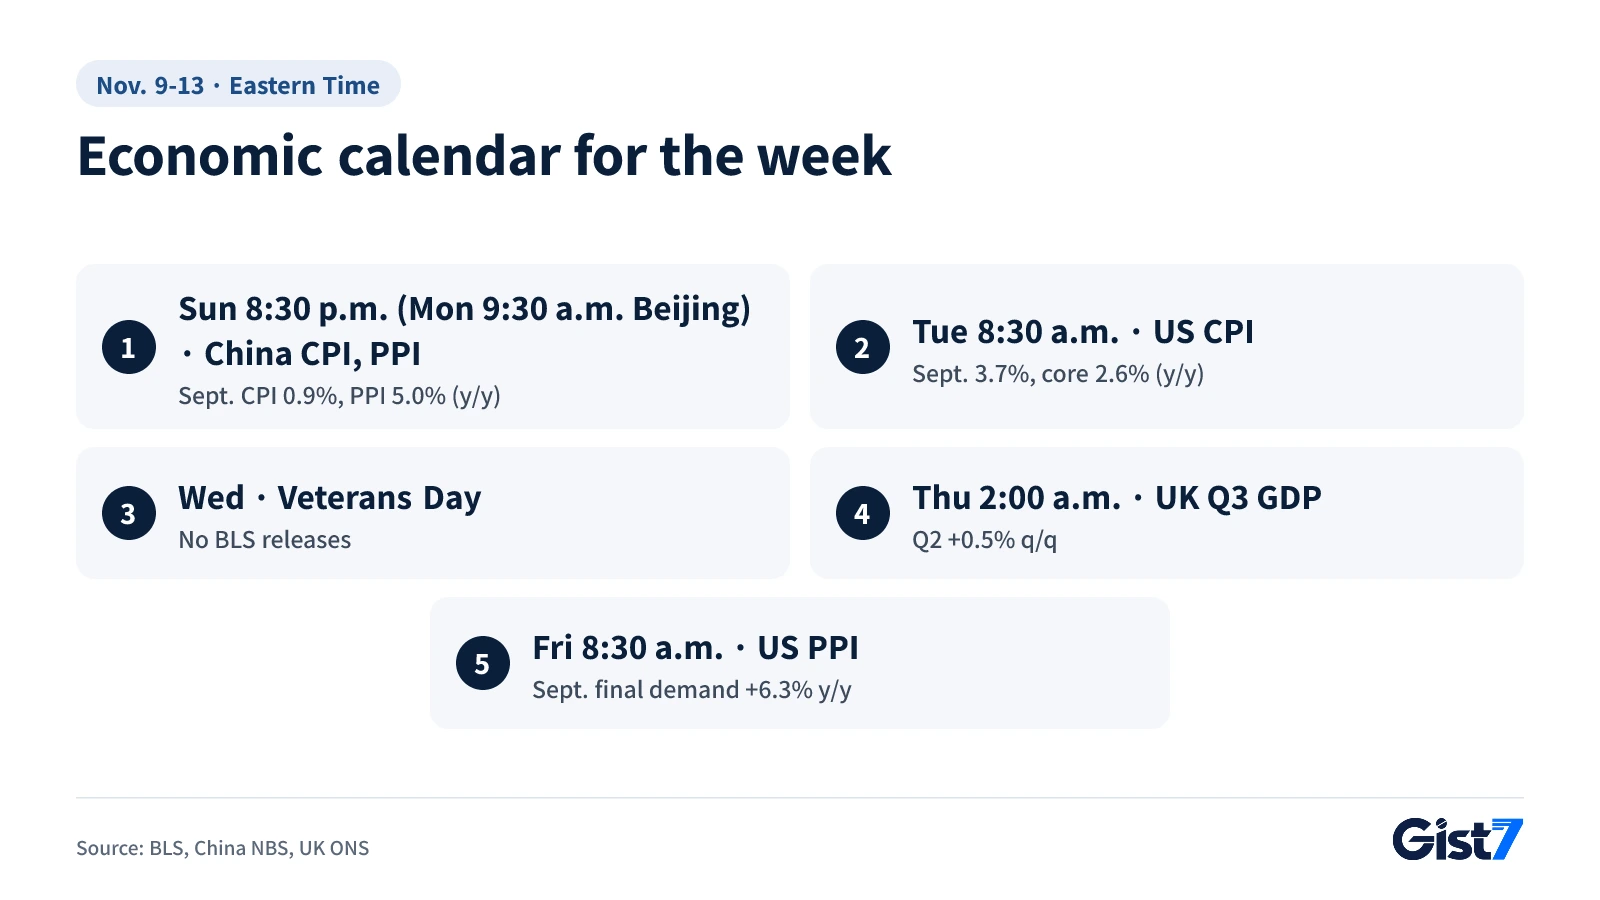
Economic calendar for the week of Nov. 9-13
The week runs from China's price data on Monday to US CPI on Tuesday, UK growth figures on Thursday and the US Producer Price Index (PPI) on Friday. Dates and times below come from each agency's official calendar. Prior readings are the latest official figures, for September (second quarter for the UK).
| Date and time (ET) | Country | Release (agency) | Prior reading | What to watch |
|---|---|---|---|---|
| Sun., Nov. 8, 8:30 p.m. (Nov. 9, 9:30 a.m. Beijing) | China | October CPI and PPI (National Bureau of Statistics) | CPI +0.9% y/y, PPI +5.0% y/y | Whether factory-gate price gains reach consumers |
| Tue., Nov. 10, 8:30 a.m. | US | October CPI and Real Earnings (BLS) | CPI +3.7%, core +2.6% y/y | How far December hike odds move |
| Wed., Nov. 11 | US | Veterans Day, no BLS releases | n/a | Federal holiday |
| Thu., Nov. 12, 2:00 a.m. (7:00 a.m. London) | UK | Q3 GDP first estimate and September monthly GDP (ONS) | Q2 +0.5% q/q | How much growth slowed |
| Fri., Nov. 13, 8:30 a.m. | US | October PPI (BLS) | Final demand +1.3% m/m, +6.3% y/y | How much energy cost is still passing into business prices |
Note: October retail sales are not part of this week. The Census Bureau calendar lists them for Tuesday, Nov. 17, at 8:30 a.m. ET.
US CPI release: where could October land?
The Cleveland Fed's inflation nowcast estimates October CPI at 3.74% year over year and core CPI at 2.48% (updated Nov. 6). A nowcast is a running estimate built from real-time data such as gasoline prices before the official number comes out. It is not a survey of economists, so it can differ from the market consensus. If it is right, headline inflation will barely change from September while core inflation eases by a little over 0.1 percentage point.
CPI measures changes in the prices urban consumers pay for goods and services. According to the BLS, September CPI rose 0.6% from August and 3.7% from a year earlier. Gasoline jumped 9.1% in a single month and accounted for more than half of the monthly increase, and the energy index stood 20.4% above its level a year before. Core CPI, which strips out food and energy, rose 0.3% on the month and 2.6% on the year. Shelter climbed 0.4%, faster than August's 0.3%.
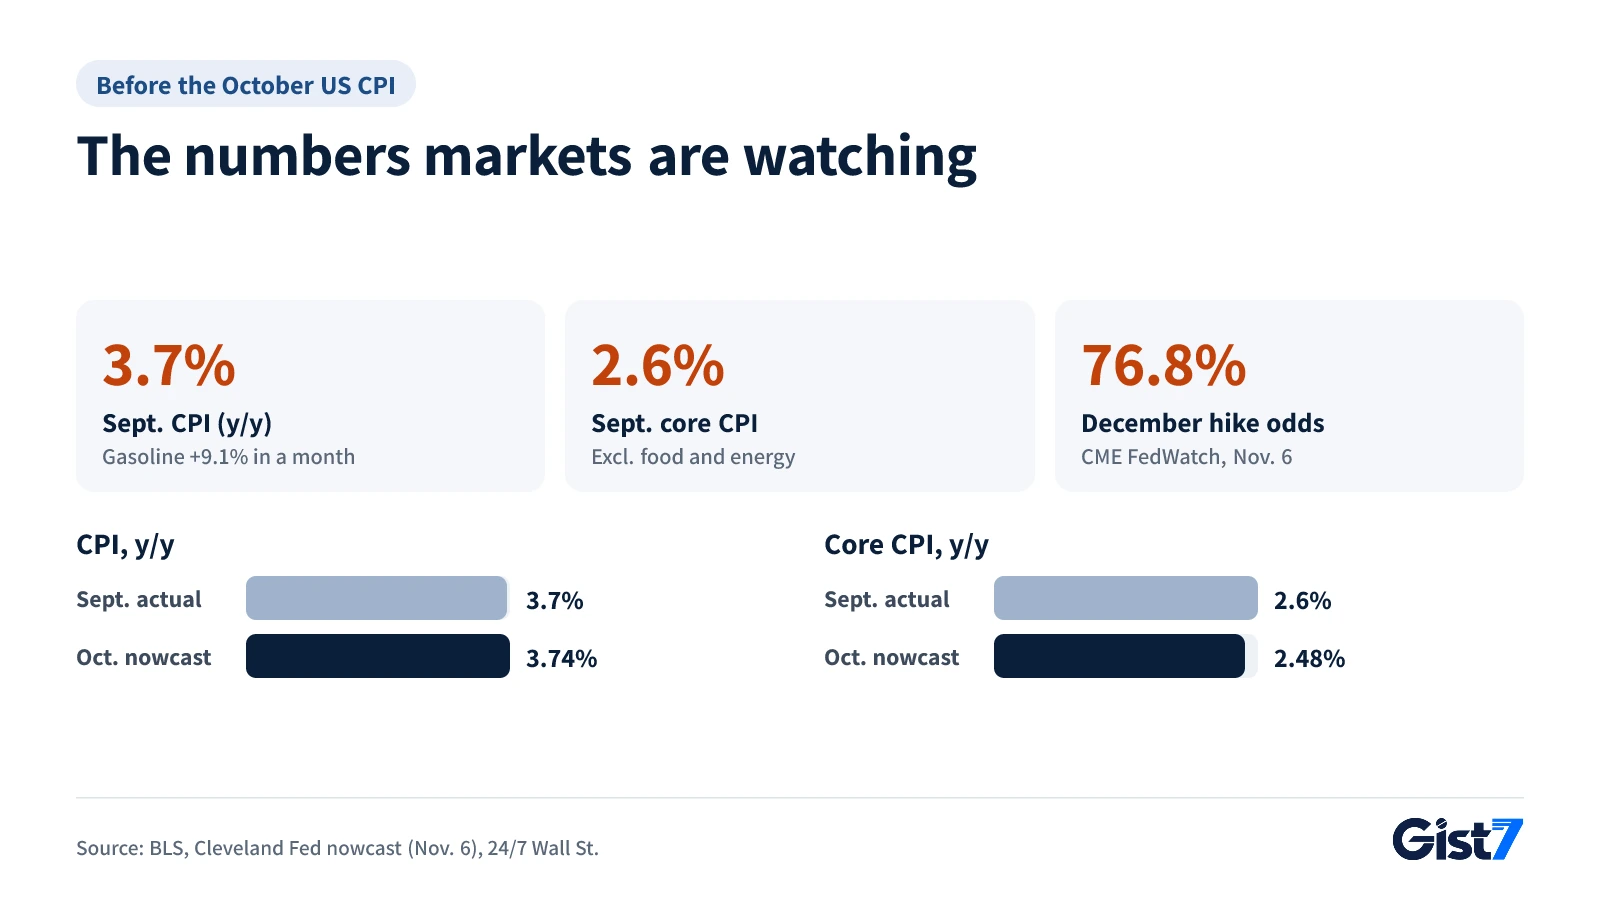
Markets care because the rate path is on the line. According to 24/7 Wall St., the federal funds target range is 3.75% to 4.00%, and CME FedWatch put the odds of a December hike at 76.8% on Nov. 6, up from 66.9% a week earlier. The jump followed an October payrolls gain of 165,000, about 2.5 times the forecast. The 2-year Treasury yield stood at 4.51% and the 10-year at 4.86% as of Nov. 6. The Federal Open Market Committee (FOMC) meets Dec. 8-9.
Is the US PPI release on Nov. 11 or Nov. 13?
The official BLS schedule puts October PPI on Friday, Nov. 13, at 8:30 a.m. ET. Some calendars list Nov. 11, but that is Veterans Day and the BLS publishes nothing that day. The PPI tracks the prices businesses receive for the goods and services they sell, and it often previews where consumer prices are heading a few months later.
BLS data show final demand PPI rose 1.3% in September and 6.3% from a year earlier. Final demand energy prices jumped 10.8%, explaining more than 80% of the rise in goods prices, and gasoline gained 20.3%. Core PPI, excluding food, energy and trade services, was up 5.0% year over year.
China's prices and UK growth: what to watch outside the US
China's consumer prices rose less than 1% in September. According to the National Bureau of Statistics, CPI was up 0.9% from a year earlier and core CPI 1.0%. Producer prices told a different story, rising 5.0% year over year and 1.2% on the month. Factory-gate prices are climbing fast while consumer prices barely move. If that gap holds in October, it would suggest Chinese companies cannot pass higher costs on to buyers. For countries that import intermediate goods from China, it can also mean pricier inputs.
The UK Office for National Statistics (ONS) will publish its first estimate of third-quarter GDP and September monthly GDP on Nov. 12. Second-quarter growth was 0.5% quarter on quarter, revised up from an initial 0.4% (published Sept. 30).
Why core inflation deserves the first look
In September, headline CPI (3.7%) ran 1.1 percentage points above core CPI (2.6%), and most of that gap came from energy. That is why core inflation and shelter are the better guide to the trend this time. Energy prices can reverse quickly. Shelter and service prices tend to stay put once they rise.
If core inflation eases toward 2.5%, as the nowcast suggests, 77% odds of a December hike may look a bit ahead of the data. If core instead rises 0.3% or more on the month again, as it did in September, that would signal the energy shock spreading into other prices. Rate worries were also part of the backdrop when the Nasdaq fell 5.5% after the midterm elections. The sharp drop in oil covered in that piece came after the election and will not show up in October data. Its effect will appear in the November CPI, due in December.
Market impact map
For the week of Nov. 9-13, market direction hinges largely on Tuesday's CPI report. Arrows in the table read "core CPI above / below the Cleveland Fed nowcast (2.48% y/y)". The nowcast is used here as a reference point, not as the market consensus.
| Asset / indicator | Direction | Strength | Link (why) |
|---|---|---|---|
| 2-year Treasury yield | ↑ / ↓ | Strong | The maturity that prices December hike odds first |
| 10-year Treasury yield | ↑ / ↓ | Medium | Moves with the inflation outlook and the term premium |
| 10-year minus 2-year spread | ↓ / ↑ | Medium | Short-term yields tend to react more |
| US Dollar Index | ↑ / ↓ | Medium | Higher US rates make dollar assets more attractive |
| Korean won per dollar | ↑ / ↓ | Medium | The won tends to weaken when the dollar strengthens, alongside foreign stock flows |
| Gold | ↓ / ↑ | Medium | It pays no interest, so higher rates reduce its relative appeal |
| Nasdaq | ↓ / ↑ | Strong | Higher discount rates cut the value of growth stocks' future earnings more |
| S&P 500 | ↓ / ↑ | Medium | Rate pressure feeds through its heavy weighting in megacap tech |
| Bitcoin | ↓ / ↑ | Medium | Demand for risk assets tends to fade as hike expectations rise |
| KOSPI (South Korea) | ↓ / ↑ | Medium | A weaker won and foreign selling often coincide |
| Korea 3-year government bond | ↑ / ↓ | Weak | Tends to follow US rates with a lag |
Little direct impact: Oil (WTI) (it feeds into inflation data rather than reacting to the release)
- Borrowing costs: If hike expectations build, yields that guide mortgage and auto loan rates could face upward pressure.
- Travel and imports: A stronger dollar makes foreign trips and imported goods cheaper for US buyers, and dearer for those paying in other currencies.
- Import prices: If China's PPI keeps climbing, Chinese-made components and consumer goods could get more expensive.
Market reactions can vary with other factors, and this table is not a basis for investment decisions.
What to watch next
| Date and time (ET) | Indicator / event | Prior reading | Link to this story | If it comes in... |
|---|---|---|---|---|
| Sun., Nov. 15, 9:00 p.m. (Nov. 16, 10:00 a.m. Beijing) | China October industrial output, retail sales, fixed-asset investment (NBS) | September data (NBS) | The real economy behind the price trend | Weak spending tends to weigh on the yuan and commodity demand hopes |
| Tue., Nov. 17, 8:30 a.m. | US October retail sales (Census Bureau) | September data (Census Bureau) | Whether consumers hold up under price pressure | Strong: yields and dollar ↑; weak: hike expectations ↓ |
| Fri., Dec. 4, 8:30 a.m. | US November jobs report (BLS) | October payrolls +165,000, unemployment 4.1% | Last jobs check before the December FOMC | Another strong print tends to lift hike bets and weigh on gold and growth stocks |
| Wed., Dec. 9, 2:00 p.m. | FOMC rate decision (Dec. 8-9) | 3.75%-4.00% | This week's CPI and PPI feed the decision | A hike or hawkish signal tends to lift the dollar and weigh on gold and growth stocks |
Frequently asked questions
When is the October US CPI released?
The BLS releases it on Tuesday, Nov. 10, 2026, at 8:30 a.m. ET. That is 10:30 p.m. in Seoul and Tokyo, since daylight saving time ended on Nov. 1.
Is the US PPI released on Nov. 11 or Nov. 13?
The official BLS schedule lists Friday, Nov. 13, at 8:30 a.m. ET. Nov. 11 is Veterans Day, and the BLS publishes nothing that day.
What is the forecast for October US CPI?
The Cleveland Fed nowcast, updated Nov. 6, estimates headline CPI at 3.74% and core CPI at 2.48% year over year. It is a model estimate based on real-time data and may differ from the market consensus.
Are US retail sales released the week of Nov. 9-13?
No. The Census Bureau calendar lists October retail sales for Tuesday, Nov. 17, at 8:30 a.m. ET.
How could a hot CPI report affect the dollar?
Higher hike expectations tend to strengthen the dollar against currencies such as the Korean won. Reactions can still vary with stock flows and risk sentiment.
Why do China's CPI and PPI matter for other markets?
China is a major trading partner for many economies, so its prices reflect both demand and import costs. When PPI (5.0% in September) runs far above CPI (0.9%), Chinese intermediate goods are getting pricier, which can raise import costs elsewhere.
References
- Consumer Price Index, September 2026 — U.S. Bureau of Labor Statistics
- Producer Price Index, September 2026 — U.S. Bureau of Labor Statistics
- Release Calendar, November 2026 — U.S. Bureau of Labor Statistics
- 2026 Economic Indicator Calendar — U.S. Census Bureau
- Regular Press Release Calendar of NBS in 2026 — National Bureau of Statistics of China
- Consumer Price Index in September 2026 — National Bureau of Statistics of China
- Industrial Producer Price Indexes in September 2026 — National Bureau of Statistics of China
- Release calendar (GDP) — Office for National Statistics
- Inflation Nowcasting — Federal Reserve Bank of Cleveland
- Odds of a December Rate Hike Jump to 77% After a Blowout Jobs Report — 24/7 Wall St.